Performance-based Asset Weighting(MTF)**Performance-Based Asset Weighting (MTF/Symbol Free Setting)**
#### Overview
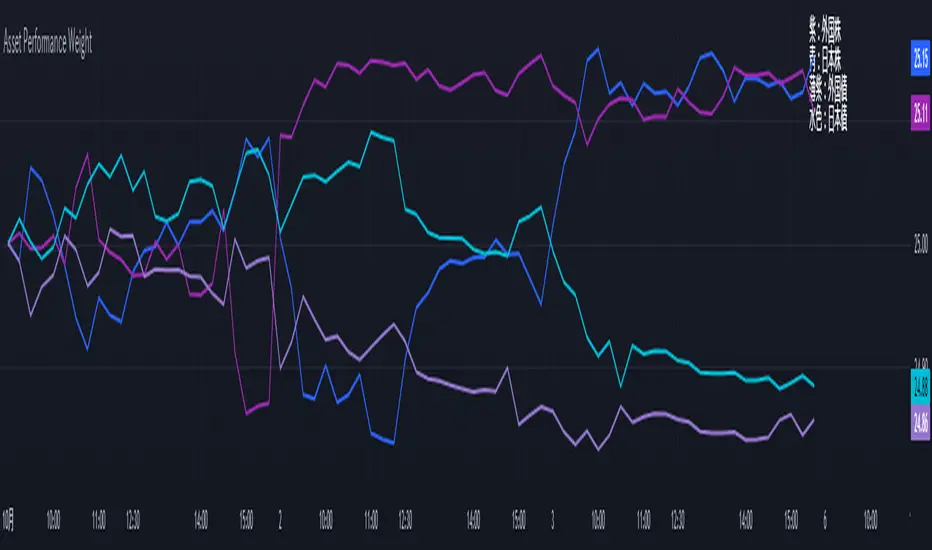
This indicator is a tool that visualizes the relative strength of performance (price change rate) as “weight (allocation ratio)” for **four user-defined stocks**.
By setting any specified past point in time as the baseline (where all symbols are equally weighted at 25%), it aims to provide an intuitive understanding of which symbols outperformed others and attracted capital, or underperformed and saw capital outflows.
**【Default Settings and Application Scenario: Pension Fund Rebalancing Analysis】**
The default settings reference the basic portfolio of Japan's Government Pension Investment Fund (GPIF), configuring four major asset classes: domestic equities, foreign equities, domestic bonds, and foreign bonds. It is known that when market fluctuations cause deviations from this equal-weighted ratio, rebalancing occurs to restore the original ratio (selling assets whose weight has increased and buying assets whose weight has decreased).
Analyzing using this default setting can serve as a reference point for considering **“whether rebalancing sales (or purchases) by pension funds and similar entities are likely to occur in the future.”**
**【Important: Usage Notes】**
The weights shown by this indicator are **theoretical reference values** calculated solely based on performance from the specified start date. Even if large investors conduct significant rebalancing (asset buying/selling) during the period, those transactions themselves are not reflected in this chart's calculations.
Therefore, please understand that the actual portfolio ratios may differ. **Use this solely as a rough guideline. **
#### Key Features
* **Freely configure the 4 assets for analysis:** You can freely set any 4 assets (stocks, indices, currencies, cryptocurrencies, etc.) you wish to compare via the settings screen.
* **Performance-based weight calculation:** Rather than simple price composition ratios, it calculates each asset's price change since the specified start date as a “performance index” and displays each asset's proportion of the total sum.
* **Freely set analysis start date:** You can set any desired starting point for analysis, such as “after the XX shock” or “after earnings announcements,” using the calendar.
* **Multi-Timeframe (MTF) Support:** Independently of the timeframe displayed on the chart, you can freely select the timeframe (e.g., 1-hour, 4-hour, daily) used by the indicator for calculations.
#### Calculation Principle
This indicator calculates weights in the following three steps:
1. **Obtaining the Base Price**
Obtain the closing price for each of the four stocks on the user-set “Start Date for Weight Calculation.” This becomes the **base price** for analysis.
2. **Calculating the Performance Index**
Divide the current price of each stock by the **base price** obtained in Step 1 to calculate the “Performance Index”.
`Performance Index = Current Price ÷ Base Date Price`
This quantifies how many times the current performance has increased compared to the base date performance, which is set to “1”.
3. **Calculating Weights**
Sum the “Performance Indexes” of the four stocks. Then, calculate the percentage contribution of each stock's Performance Index to this total sum and plot it on the chart.
`Weight (%) = (Individual Performance Index ÷ Total Performance Index of 4 Stocks) × 100`
Using this logic, on the analysis start date, all stocks' performance indices are set to “1”, so the weights start equally at 25%.
#### Usage
* **Application Example 1: Market Sentiment Analysis (Using Default Settings)**
Analyze using the default asset classes. By observing the relative strength between “Equities” and “Bonds”, you can assess whether the market is risk-on or risk-off.
* **Application Example 2: Sector/Theme Strength Analysis**
Configure settings for groups like “Top 4 semiconductor stocks” or “4 GAFAM stocks.” Setting the start date to the beginning of the year or earnings season allows you to instantly compare which stocks within the same sector are performing best.
* **Application Example 3: Cryptocurrency Power Map Analysis**
By setting major cryptocurrencies like “BTC, ETH, SOL, ADA,” you can analyze which currencies are attracting market capital.
**【About Legend Display】**
Due to Pine Script specification constraints, the legend on the chart will display fixed names: **“Stock 1” to “Stock 4”. **
Please note that the symbol you entered for “Symbol 1” in the settings corresponds to the “Symbol 1” line on the chart.
#### Settings
* **Symbol 1 to Symbol 4:** Set the four symbols you wish to analyze.
* **Timeframe for Calculation:** Select the timeframe the indicator references when calculating weights.
* **Start Date for Weight Calculation:** This serves as the base date for comparing performance.
#### Disclaimer
This script is solely a tool to assist with market analysis and does not recommend buying or selling any specific financial instruments. Please make all final investment decisions at your own discretion.
-------------------------------------------------------------------------------------------------------------------
**Performance-based Asset Weighting(MTF・シンボル自由設定)**
#### 概要
このインジケーターは、**ユーザーが自由に設定した4つの銘柄**について、パフォーマンス(騰落率)の相対的な強さを「ウェイト(構成比率)」として可視化するツールです。
指定した過去の任意の時点を基準(全銘柄が均等な25%)として、そこからどの銘柄のパフォーマンスが他の銘柄を上回り、資金が向かっているのか、あるいは下回っているのかを直感的に把握することを目的としています。
**【デフォルト設定と活用シナリオ:年金基金のリバランス考察】**
デフォルト設定では、日本の年金積立金管理運用独立行政法人(GPIF)の基本ポートフォリオを参考に、主要4資産クラス(国内株式, 外国株式, 国内債券, 外国債券)が設定されています。市場の変動によってこの均等な比率に乖離が生じると、元の比率に戻すためのリバランス(比率が増えた資産を売り、減った資産を買う)が行われることが知られています。
このデフォルト設定で分析することで、**「今後、年金基金などによるリバランスの売り(買い)が発生する可能性があるか」を考察するための、一つの目安として利用できます。**
**【重要:利用上の注意点】**
このインジケーターが示すウェイトは、あくまで指定した開始日からのパフォーマンスのみを基に算出した**理論上の参考値**です。実際に大口投資家などが途中で大規模なリバランス(資産の売買)を行ったとしても、その取引自体はこのチャートの計算には反映されません。
そのため、実際のポートフォリオ比率とは異なる可能性があることをご理解の上、**あくまで大まかな目安としてご活用ください。**
#### 主な特徴
* **分析対象の4銘柄を自由に設定可能:** 設定画面から、比較したい4つの銘柄(株式、指数、為替、仮想通貨など)を自由に設定できます。
* **パフォーマンス基準のウェイト計算:** 単純な価格の構成比ではなく、指定した開始日からの各銘柄の騰落を「パフォーマンス指数」として算出し、その合計に占める各銘柄の割合を表示します。
* **分析開始日の自由な設定:** 「〇〇ショック後」「決算発表後」など、分析したい任意の時点をカレンダーから設定できます。
* **マルチタイムフレーム(MTF)対応:** チャートに表示している時間足とは別に、インジケーターが計算に使う時間足(1時間足、4時間足、日足など)を自由に選択できます。
#### 計算の原理
このインジケーターは、以下の3ステップでウェイトを算出しています。
1. **基準価格の取得**
ユーザーが設定した「ウェイト計算の開始日」における、4つの各銘柄の終値を取得し、これを分析の**基準価格**とします。
2. **パフォーマンス指数の算出**
現在の各銘柄の価格を、ステップ1で取得した**基準価格**で割ることで、「パフォーマンス指数」を算出します。
`パフォーマンス指数 = 現在の価格 ÷ 基準日の価格`
これにより、基準日のパフォーマンスを「1」とした場合、現在のパフォーマンスが何倍になっているかが数値化されます。
3. **ウェイトの算出**
4つの銘柄の「パフォーマンス指数」の合計値を算出します。そして、合計値に占める各銘柄のパフォーマンス指数の割合(%)を計算し、チャートに描画します。
`ウェイト (%) = (個別のパフォーマンス指数 ÷ 4銘柄のパフォーマンス指数の合計) × 100`
このロジックにより、分析開始日には全銘柄のパフォーマンス指数が「1」となるため、ウェイトは均等に25%からスタートします。
#### 使用方法
* **応用例1:市場のセンチメント分析(デフォルト設定利用)**
デフォルト設定の資産クラスで分析し、「株式」と「債券」の力関係を見ることで、市場がリスクオンなのかリスクオフなのかを判断する材料になります。
* **応用例2:セクター・テーマ別の強弱分析**
設定画面で、例えば「半導体関連の主要4銘柄」や「GAFAMの4銘柄」などを設定します。開始日を年初や決算時期に設定することで、同セクター内でどの銘柄が最もパフォーマンスが良いかを一目で比較できます。
* **応用例3:仮想通貨の勢力図分析**
「BTC, ETH, SOL, ADA」など、主要な仮想通貨を設定することで、市場の資金がどの通貨に向かっているのかを分析できます。
**【凡例の表示について】**
Pine Scriptの仕様上の制約により、チャート上の凡例は**「銘柄1」〜「銘柄4」という固定名で表示されます。**
お手数ですが、設定画面でご自身が「銘柄1」に入力したシンボルが、チャート上の「銘柄1」のラインに対応する、という形でご覧ください。
#### 設定項目
* **銘柄1〜銘柄4:** 分析したい4つのシンボルをそれぞれ設定します。
* **計算に使う時間足:** インジケーターがウェイトを計算する際に参照する時間足を選択します。
* **ウェイト計算の開始日:** パフォーマンスを比較する上での基準日となります。
#### 免責事項
このスクリプトはあくまで市場分析を補助するためのツールであり、特定の金融商品の売買を推奨するものではありません。投資の最終的な判断は、ご自身の責任において行ってください。
在脚本中搜索"Buy sell"
MACD Forecast [Titans_Invest]MACD Forecast — The Future of MACD in Trading
The MACD has always been one of the most powerful tools in technical analysis.
But what if you could see where it’s going, instead of just reacting to what has already happened?
Introducing MACD Forecast — the natural evolution of the MACD Full , now taken to the next level. It’s the world’s first MACD designed not only to analyze the present but also to predict the future behavior of momentum.
By combining the classic MACD structure with projections powered by Linear Regression, this indicator gives traders an anticipatory, predictive view, redefining what’s possible in technical analysis.
Forget lagging indicators.
This is the smartest, most advanced, and most accurate MACD ever created.
🍟 WHY MACD FORECAST IS REVOLUTIONARY
Unlike the traditional MACD, which only reflects current and past price dynamics, the MACD Forecast uses regression-based projection models to anticipate where the MACD line, signal line, and histogram are heading.
This means traders can:
• See MACD crossovers before they happen.
• Spot trend reversals earlier than most.
• Gain an unprecedented timing advantage in both discretionary and automated trading.
In other words: this indicator lets you trade ahead of time.
🔮 FORECAST ENGINE — POWERED BY LINEAR REGRESSION
At its core, the MACD Forecast integrates Linear Regression (ta.linreg) to project the MACD’s future behavior with exceptional accuracy.
Projection Modes:
• Flat Projection: Assumes trend continuity at the current level.
• LinReg Projection: Applies linear regression across N periods to mathematically forecast momentum shifts.
This dual system offers both a conservative and adaptive view of market direction.
📐 ACCURACY WITH FULL CUSTOMIZATION
Just like the MACD Full, this new version comes with 20 customizable buy-entry conditions and 20 sell-entry conditions — now enhanced with forecast-based rules that anticipate crossovers and trend reversals.
You’re not just reacting — you’re strategizing ahead of time.
⯁ HOW TO USE MACD FORECAST❓
The MACD Forecast is built on the same foundation as the classic MACD, but with predictive capabilities.
Step 1 — Spot Predicted Crossovers:
Watch for forecasted bullish or bearish crossovers. These signals anticipate when the MACD line will cross the signal line in the future, letting you prepare trades before the move.
Step 2 — Confirm with Histogram Projection:
Use the projected histogram to validate momentum direction. A rising histogram signals strengthening bullish momentum, while a falling projection points to weakening or bearish conditions.
Step 3 — Combine with Multi-Timeframe Analysis:
Use forecasts across multiple timeframes to confirm signal strength (e.g., a 1h forecast aligned with a 4h forecast).
Step 4 — Set Entry Conditions & Automation:
Customize your buy/sell rules with the 20 forecast-based conditions and enable automation for bots or alerts.
Step 5 — Trade Ahead of the Market:
By preparing for future momentum shifts instead of reacting to the past, you’ll always stay one step ahead of lagging traders.
🤖 BUILT FOR AUTOMATION AND BOTS 🤖
Whether for manual trading, quantitative strategies, or advanced algorithms, the MACD Forecast was designed to integrate seamlessly with automated systems.
With predictive logic at its core, your strategies can finally react to what’s coming, not just what already happened.
🥇 WHY THIS INDICATOR IS UNIQUE 🥇
• World’s first MACD with Linear Regression Forecasting
• Predictive Crossovers (before they appear on the chart)
• Maximum flexibility with Long & Short combinations — 20+ fully configurable conditions for tailor-made strategies
• Fully automatable for quantitative systems and advanced bots
This isn’t just an update.
It’s the final evolution of the MACD.
______________________________________________________
🔹 CONDITIONS TO BUY 📈
______________________________________________________
• Signal Validity: The signal will remain valid for X bars .
• Signal Sequence: Configurable as AND or OR .
🔹 MACD > Signal Smoothing
🔹 MACD < Signal Smoothing
🔹 Histogram > 0
🔹 Histogram < 0
🔹 Histogram Positive
🔹 Histogram Negative
🔹 MACD > 0
🔹 MACD < 0
🔹 Signal > 0
🔹 Signal < 0
🔹 MACD > Histogram
🔹 MACD < Histogram
🔹 Signal > Histogram
🔹 Signal < Histogram
🔹 MACD (Crossover) Signal
🔹 MACD (Crossunder) Signal
🔹 MACD (Crossover) 0
🔹 MACD (Crossunder) 0
🔹 Signal (Crossover) 0
🔹 Signal (Crossunder) 0
🔮 MACD (Crossover) Signal Forecast
🔮 MACD (Crossunder) Signal Forecast
______________________________________________________
______________________________________________________
🔸 CONDITIONS TO SELL 📉
______________________________________________________
• Signal Validity: The signal will remain valid for X bars .
• Signal Sequence: Configurable as AND or OR .
🔸 MACD > Signal Smoothing
🔸 MACD < Signal Smoothing
🔸 Histogram > 0
🔸 Histogram < 0
🔸 Histogram Positive
🔸 Histogram Negative
🔸 MACD > 0
🔸 MACD < 0
🔸 Signal > 0
🔸 Signal < 0
🔸 MACD > Histogram
🔸 MACD < Histogram
🔸 Signal > Histogram
🔸 Signal < Histogram
🔸 MACD (Crossover) Signal
🔸 MACD (Crossunder) Signal
🔸 MACD (Crossover) 0
🔸 MACD (Crossunder) 0
🔸 Signal (Crossover) 0
🔸 Signal (Crossunder) 0
🔮 MACD (Crossover) Signal Forecast
🔮 MACD (Crossunder) Signal Forecast
______________________________________________________
______________________________________________________
🔮 Linear Regression Function 🔮
______________________________________________________
• Our indicator includes MACD forecasts powered by linear regression.
Forecast Types:
• Flat: Assumes prices will stay the same.
• Linreg: Makes a 'Linear Regression' forecast for n periods.
Technical Information:
• Function: ta.linreg()
Parameters:
• source: Source price series.
• length: Number of bars (period).
• offset : Offset.
• return: Linear regression curve.
______________________________________________________
______________________________________________________
⯁ UNIQUE FEATURES
______________________________________________________
Linear Regression: (Forecast)
Signal Validity: The signal will remain valid for X bars
Signal Sequence: Configurable as AND/OR
Table of Conditions: BUY/SELL
Conditions Label: BUY/SELL
Plot Labels in the graph above: BUY/SELL
Automate & Monitor Signals/Alerts: BUY/SELL
Linear Regression (Forecast)
Signal Validity: The signal will remain valid for X bars
Signal Sequence: Configurable as AND/OR
Table of Conditions: BUY/SELL
Conditions Label: BUY/SELL
Plot Labels in the graph above: BUY/SELL
Automate & Monitor Signals/Alerts: BUY/SELL
______________________________________________________
📜 SCRIPT : MACD Forecast
🎴 Art by : @Titans_Invest & @DiFlip
👨💻 Dev by : @Titans_Invest & @DiFlip
🎑 Titans Invest — The Wizards Without Gloves 🧤
✨ Enjoy!
______________________________________________________
o Mission 🗺
• Inspire Traders to manifest Magic in the Market.
o Vision 𐓏
• To elevate collective Energy 𐓷𐓏
🎗️ In memory of João Guilherme — your light will live on forever.

RXTrend█ OVERVIEW
The "RXTrend" indicator is a technical analysis tool based on a unique approach to trend identification using RSI values from overbought and oversold zones. Designed for traders seeking a precise tool to identify key market levels and trend direction, the indicator offers flexible settings, dynamic trend lines, candlestick coloring, and buy/sell signals, supported by alerts for key events.
█ CONCEPTS
"RXTrend" leverages the Relative Strength Index (RSI) to identify overbought and oversold zones, which are often significant areas on the chart due to potentially higher volume, increased volatility, or acting as pivot points. To address this, I created an indicator that uses RSI values from these zones, mapping them to price levels to determine the trend. Additionally, for a clearer market picture, boxes are added to highlight overbought and oversold zones on the chart, and candlestick coloring is based on the direction of the RSI moving average. This provides further confirmation of the trend direction and identifies potential correction or reversal points. The indicator is universal and works across all markets (stocks, forex, cryptocurrencies) and timeframes.
█ FEATURES
- RSI Calculation: Calculates RSI based on the closing price over a specified period, with a default length of 14.
- Trend Line: A smoothed trend line based on mapping RSI values from overbought (for downtrends) or oversold (for uptrends) zones to price levels. RSI values are transformed into prices using the price range from a selected period (default: 50 bars) and then smoothed to form the trend line. The line changes color based on the trend direction (blue for uptrend, orange for downtrend).
- Candlestick Coloring: Option to color candles based on the direction of the RSI moving average (RSI MA). Candle colors align with the trend and box colors (blue for uptrend, orange for downtrend, gray for neutral).
- Overbought and Oversold Zones: Identifies overbought (RSI > OB) and oversold (RSI < OS) levels, drawing dynamic boxes on the price chart to reflect these zones. Boxes update in real-time, adjusting to new highs and lows.
- Buy and Sell Signals: Generates buy signals (blue "Buy" labels) when the price crosses above the smoothed oversold line and sell signals (orange "Sell" labels) when the price crosses below the smoothed overbought line.
- Shadow Fill: Option to fill the space between the trend line and price (HL2) with adjustable transparency, aiding visual trend assessment.
Alerts: Built-in alerts for:
- Buy and sell signals.
- Appearance of new overbought/oversold boxes.
- RSI MA direction change (candle color change to uptrend or downtrend).
Customization: Allows adjustment of RSI length, overbought/oversold levels, smoothing period, colors, box and label transparency, and the option to keep boxes after RSI returns to normal.
█ HOW TO USE
Add to Chart: Apply the indicator to your TradingView chart via the Pine Editor or Indicators menu.
Configure Settings:
RSI Settings:
- RSI Length: Sets the RSI calculation period (default: 14).
- Overbought Level (OB): Sets the overbought threshold (default: 70).
- Oversold Level (OS): Sets the oversold threshold (default: 30).
Price Settings:
- Price Range Lookback: Defines the period for calculating the price range (default: 50).
Candle Coloring:
- Color Candles: Enables/disables candle coloring based on RSI MA direction.
- RSI MA Length: Sets the RSI moving average period (default: 21).
Smoothing Settings:
- Smoothing Length: Degree of trend line smoothing (default: 5).
Colors:
- Trend Colors: Customize colors for uptrend (default: blue), downtrend (default: orange), and shadow fill.
Box Settings:
- Box Transparency: Adjusts box transparency (0-100).
- Box Colors: Sets colors for overbought (orange) and oversold (blue) zones.
- Keep Boxes: Determines if boxes remain after RSI returns to normal.
Signals:
- Show Buy/Sell Signals: Enables/disables signal label display.
- Label Transparency: Adjusts signal label transparency.
Interpreting Signals:
- Trend Line: Shows market direction (blue for uptrend, orange for downtrend).
- Buy Signals: Blue "Buy" label appears when the price crosses above the smoothed oversold line, signaling a potential uptrend.
- Sell Signals: Orange "Sell" label appears when the price crosses below the smoothed overbought line, signaling a potential downtrend.
- Overbought/Oversold Boxes: Orange boxes indicate overbought zones (RSI > OB), blue boxes indicate oversold zones (RSI < OS). Boxes expand dynamically in real-time.
- Candlestick Coloring: Candle colors align with the trend and box colors, reflecting RSI MA direction.
- Alerts: Set up alerts in TradingView for buy/sell signals, new overbought/oversold boxes, or RSI MA direction changes.
- Combining with Other Tools: Use the indicator alongside support/resistance levels, Fair Value Gaps (FVG), or other indicators to confirm signals.
█ APPLICATIONS
The "RXTrend" indicator is designed to identify key market zones and trend direction, making it useful for trend-following and reversal strategies. It enables:
- Trend Confirmation: Candlestick coloring and the trend line help assess the dominant market direction, supporting entry or exit decisions. The trend line can act as a significant support/resistance level, and a price bounce from it may provide a good entry point, especially when confirmed by Fibonacci levels. Additionally, the appearance of overbought/oversold boxes combined with a change in candle color (RSI MA direction) may indicate an impending correction. This allows analysis of potential market overextension and correction endings, enabling multiple entries within a trend.
- Overbought and Oversold Zone Identification: Boxes highlight potential reversal or correction points, especially when combined with support/resistance levels or FVG.
- Signal-Based Strategies: Buy and sell signals can be used as entry points in a trend or as warnings of potential reversals.
█ NOTES
- The indicator is universal and works across all markets and timeframes due to its RSI-based and price-mapping logic.
- Adjust settings (e.g., RSI length, OB/OS levels, smoothing) to suit your trading style and timeframe.
- Use in conjunction with other technical analysis tools to enhance signal accuracy.

Volume ClusteringThis Volume Clustering script is a powerful tool for analyzing intraday trading dynamics by combining two key metrics: volume Z-Score and Cumulative Volume Delta (CVD). By categorizing market activity into distinct clusters, it helps you identify high-conviction trading opportunities and understand underlying market pressure.
How It Works
The script operates on a simple, yet effective, premise: it classifies each trading bar based on its statistical significance (volume Z-Score) and buying/selling pressure (CVD).
Volume Z-Score
The volume Z-Score measures how far the current bar's volume is from its average, helping to identify periods of unusually high or low volume. This metric is a powerful way to spot when institutional or large players might be entering the market. A high Z-Score suggests a significant event is taking place, regardless of direction.
Cumulative Volume Delta (CVD)
CVD tracks the net buying and selling pressure across different timeframes. The script uses a lower timeframe (e.g., 1-minute) and anchors it to a higher timeframe (e.g., 1-day) to capture intraday pressure. A positive CVD indicates more buying pressure, while a negative CVD suggests more selling pressure.
Cluster Categories
The script analyzes the confluence of these two metrics to assign a cluster to each bar, providing actionable insights. The clusters are color-coded and labeled to make them easy to interpret:
🟢 High Conviction Bullish: Unusually high volume (high Z-Score) combined with significant buying pressure (high CVD). This cluster suggests strong bullish momentum.
🔴 High Conviction Bearish: Unusually high volume (high Z-Score) coupled with significant selling pressure (low CVD). This cluster suggests strong bearish momentum.
🟡 Low Conviction/Noise: Low to moderate volume and mixed buying/selling pressure. This represents periods of indecision or consolidation, where market noise is more prevalent.
🟣 Other Clusters: The script also identifies other combinations, such as high volume with moderate CVD, or low volume with high CVD, which can provide additional context for understanding market dynamics.
Key Features & Customization
The script offers several customizable settings to tailor the analysis to your specific trading style:
Z-Score Lookback Length: Adjust the lookback period for calculating the average volume. A shorter period focuses on recent volume trends, while a longer period provides a broader context.
CVD Anchor & Lower Timeframe: Define the timeframes used for CVD calculation. You can anchor the analysis to a daily or weekly timeframe while using a lower timeframe (e.g., 1-minute) to capture granular intraday pressure.
High/Low Volume Mode: Toggle between "High Volume" mode (which uses 90th and 10th percentiles for clustering) and "Low Volume" mode (which uses 75th and 25th percentiles). This allows you to choose whether to focus on extreme events or more subtle shifts in market sentiment.

Multiplied and Divided Moving Average ### Multiplied and Divided Moving Average Indicator
**Description**:
The "Multiplied and Divided Moving Average" indicator is a customizable tool for TradingView users, designed to create dynamic bands around a user-selected moving average (MA). It calculates a moving average (SMA, EMA, WMA, VWMA, or RMA) and generates a user-defined number of lines above and below it by multiplying and dividing the MA by linearly spaced factors. These bands serve as potential support and resistance levels, aiding in trend identification, mean reversion strategies, or breakout detection. Optional Buy/Sell labels appear when the price crosses below the divided MAs (Buy) or above the multiplied MAs (Sell), providing clear visual cues for trading opportunities.
**Key Features**:
- **Flexible MA Types**: Choose from Simple (SMA), Exponential (EMA), Weighted (WMA), Volume-Weighted (VWMA), or Running (RMA) moving averages.
- **Customizable Bands**: Set the number of lines (0–10) above and below the MA, allowing tailored analysis for any market or timeframe.
- **Dynamic Factors**: Bands are created using factors that scale linearly from 1 to a user-defined maximum (default: 5.0), creating intuitive overbought/oversold zones.
- **Buy/Sell Signals**: Optional labels highlight potential entry (Buy) and exit (Sell) points when the price crosses the bands.
- **Clear Visuals**: The main MA is plotted in blue, with green (multiplied) and red (divided) lines using graduated transparency for easy differentiation.
**Inputs**:
- **MA Type**: Select the moving average type (default: SMA).
- **MA Length**: Set the MA period (default: 14).
- **Number of Lines Above/Below**: Choose how many bands to plot above and below the MA (default: 4, range: 0–10).
- **Max Factor**: Define the largest multiplier/divisor for the outermost bands (default: 5.0).
- **Source**: Select the price data for the MA (default: close).
- **Show Buy/Sell Labels**: Enable or disable Buy/Sell labels (default: true).
**How It Works**:
1. Calculates the chosen moving average based on user inputs.
2. Creates up to 10 lines above the MA (e.g., MA × 2, ×3, ×4, ×5 for `numLines=4`, `maxFactor=5`) and 10 below (e.g., MA ÷ 2, ÷3, ÷4, ÷5).
3. Plots the main MA in blue, multiplied lines in green, and divided lines in red, with transparency increasing for outer bands.
4. If enabled, displays "Buy" labels when the price crosses below any divided MA and "Sell" labels when it crosses above any multiplied MA, positioned at the outermost band.
**Use Cases**:
- **Trend Analysis**: Use the bands as dynamic support/resistance to confirm trend direction or reversals.
- **Mean Reversion**: Identify overbought (near multiplied MAs) or oversold (near divided MAs) conditions.
- **Breakout Trading**: Monitor price crossovers of the outermost bands for potential breakout signals.
- **Signal Confirmation**: Use Buy/Sell labels for swing trading or to complement other indicators.
**How to Use**:
1. Copy the script into TradingView’s Pine Editor.
2. Compile and apply it to your chart (e.g., stocks, forex, crypto).
3. Adjust inputs like `numLines`, `maxFactor`, or `maType` to fit your strategy.
4. Enable `Show Buy/Sell Labels` to visualize trading signals.
5. Test on various timeframes (e.g., 1H, 4H, 1D) and assets to optimize settings.
**Example Settings**:
- **Swing Trading**: Use `numLines=3`, `maxFactor=4`, `maType=EMA`, `maLength=20` on a 4-hour chart.
- **Intraday**: Try `numLines=2`, `maxFactor=3`, `maType=SMA`, `maLength=10` on a 15-minute chart.
**Notes**:
- **Performance**: Supports up to 20 bands (10 above, 10 below), staying within TradingView’s 64-plot limit.
- **False Signals**: In choppy markets, frequent crossovers may occur. Combine with trend filters (e.g., ADX, higher-timeframe MA) to reduce noise.
- **Enhancements**: Add alerts via TradingView’s alert system for Buy/Sell signals, or experiment with different `maxFactor` values for volatility.
**Limitations**:
- Bands are reactive, as they’re based on a moving average, so confirm signals with other indicators.
- High `numLines` values may clutter the chart; use 2–4 for clarity.
- Signals may lag in fast-moving markets due to the MA’s smoothing effect.
This indicator is perfect for traders seeking a customizable, visually clear tool to enhance technical analysis on TradingView. For support, feature requests (e.g., alerts, custom colors), or community discussion, visit TradingView’s forums or contact the script author.

Fixed Range Volume Profile"Distribution of transaction volume by price group (transaction volume by price block)"
Instructions for use (Professional Manual)
1. a basic concept
By vertical axis (price), shows the cumulative trading volume traded in the segment.
The longer the block, the more transactions took place in that price range.
Colors distinguish between buying/selling strength (green = buying advantage, red = selling advantage).
2. Key components
POC (Point of Control)
→ Longest block (most traded price segment, "key selling point").
VAH / VAL (Value Area High/Low)
→ Top/bottom segments where approximately 70% of the total volume is formed.
→ Role of "Major Support/Resistance".
High Capacity Node (HVN)
→ Significantly higher trading volumes → strong support/resistance.
Low Volume Node (LVN)
→ Low volume section → areas where prices are easily passed.
3. practical application
Find Support/Resistance
The thickest block (POC) is used as a place where prices often rebound/resist.
a trading entry/liquidation strategy
Buy if the price is supported near HVN,
When breaking through the LVN, fast movement (gap movement) can be expected.
break/goal setting
Finger = Under the LVN,
Target = Next HVN.
Judgment of trends
When the block distribution is concentrated above, "Increase to Collection Section"
If you're driven below, you're "in a downtrend to a variance section."
4. Precautions
The volume distribution is "past data based" and is not an indicator of the future.
Rather than using it alone, it is more effective to combine with Fibonacci, trend lines, and candle patterns.
In particular, in the volatile market, the LVN breakthrough → may signal a surge/fall.
In summary, this block indicator is "a map showing the most market participants at any price point".
In other words, it is useful for finding support/resistance as a tool for analyzing sales and establishing the basis for trading strategies.

Cumulative Volume Delta Candles Aggregated (Lite)Cumulative Volume Delta Candles Aggregated (Lite)
Multi-Exchange CVD Visualization in Candle Format
This indicator provides an aggregated Cumulative Volume Delta (CVD) view across multiple major perpetual futures exchanges in one chart. It is designed for traders who want a broader perspective on buying and selling pressure without switching between multiple charts or relying on a single exchange feed.
What It Does
Combines volume delta data from Binance, Bybit, OKX, Bitget, and Coinbase into a unified representation.
Displays CVD as candlesticks, where each candle reflects the open, high, low, and close of cumulative delta for the selected period.
Offers a clear visual of how buying and selling pressure evolves across markets in a structured, familiar candle format.
Key Features
✔ Exchange Aggregation: Incorporates data from several top futures markets available on TradingView.
✔ Anchor Reset: Allows you to set an anchor timeframe (e.g., daily) to reset cumulative values for better readability and analysis.
✔ Unit Normalization: Since exchanges report volumes in different units, the indicator normalizes all data and outputs values denominated in the base currency (coins) for consistency.
✔ Hidden OHLC Outputs: Provides open, high, low, and close values as hidden plots for use with other indicators or strategies.
✔ Lightweight Design: Optimized for efficiency while handling multiple real-time data requests.
Why It’s Different
Unlike standard single-exchange CVD tools, this indicator aggregates the majority of perpetual volume data available on TradingView, offering a more representative view of market sentiment. The candle-based representation of CVD introduces an additional layer of structure, helping traders identify shifts in momentum and pressure with more context than a simple cumulative line.
Use Cases
- Spotting aggregated buy/sell pressure trends across multiple exchanges.
- Confirming breakout or reversal signals with broader volume delta context.
- Serving as a custom data source for other indicators or algorithmic strategies.

Adaptive Rolling Quantile Bands [CHE] Adaptive Rolling Quantile Bands
Part 1 — Mathematics and Algorithmic Design
Purpose. The indicator estimates distribution‐aware price levels from a rolling window and turns them into dynamic “buy” and “sell” bands. It can work on raw price or on *residuals* around a baseline to better isolate deviations from trend. Optionally, the percentile parameter $q$ adapts to volatility via ATR so the bands widen in turbulent regimes and tighten in calm ones. A compact, latched state machine converts these statistical levels into high-quality discretionary signals.
Data pipeline.
1. Choose a source (default `close`; MTF optional via `request.security`).
2. Optionally compute a baseline (`SMA` or `EMA`) of length $L$.
3. Build the *working series*: raw price if residual mode is off; otherwise price minus baseline (if a baseline exists).
4. Maintain a FIFO buffer of the last $N$ values (window length). All quantiles are computed on this buffer.
5. Map the resulting levels back to price space if residual mode is on (i.e., add back the baseline).
6. Smooth levels with a short EMA for readability.
Rolling quantiles.
Given the buffer $X_{t-N+1..t}$ and a percentile $q\in $, the indicator sorts a copy of the buffer ascending and linearly interpolates between adjacent ranks to estimate:
* Buy band $\approx Q(q)$
* Sell band $\approx Q(1-q)$
* Median $Q(0.5)$, plus optional deciles $Q(0.10)$ and $Q(0.90)$
Quantiles are robust to outliers relative to means. The estimator uses only data up to the current bar’s value in the buffer; there is no look-ahead.
Residual transform (optional).
In residual mode, quantiles are computed on $X^{res}_t = \text{price}_t - \text{baseline}_t$. This centers the distribution and often yields more stationary tails. After computing $Q(\cdot)$ on residuals, levels are transformed back to price space by adding the baseline. If `Baseline = None`, residual mode simply falls back to raw price.
Volatility-adaptive percentile.
Let $\text{ATR}_{14}(t)$ be current ATR and $\overline{\text{ATR}}_{100}(t)$ its long SMA. Define a volatility ratio $r = \text{ATR}_{14}/\overline{\text{ATR}}_{100}$. The effective quantile is:
Smoothing.
Each level is optionally smoothed by an EMA of length $k$ for cleaner visuals. This smoothing does not change the underlying quantile logic; it only stabilizes plots and signals.
Latched state machines.
Two three-step processes convert levels into “latched” signals that only fire after confirmation and then reset:
* BUY latch:
(1) HLC3 crosses above the median →
(2) the median is rising →
(3) HLC3 prints above the upper (orange) band → BUY latched.
* SELL latch:
(1) HLC3 crosses below the median →
(2) the median is falling →
(3) HLC3 prints below the lower (teal) band → SELL latched.
Labels are drawn on the latch bar, with a FIFO cap to limit clutter. Alerts are available for both the simple band interactions and the latched events. Use “Once per bar close” to avoid intrabar churn.
MTF behavior and repainting.
MTF sourcing uses `lookahead_off`. Quantiles and baselines are computed from completed data only; however, any *intrabar* cross conditions naturally stabilize at close. As with all real-time indicators, values can update during a live bar; prefer bar-close alerts for reliability.
Complexity and parameters.
Each bar sorts a copy of the $N$-length window (practical $N$ values keep this inexpensive). Typical choices: $N=50$–$100$, $q_0=0.15$–$0.25$, $k=2$–$5$, baseline length $L=20$ (if used), adaptation strength $s=0.2$–$0.7$.
Part 2 — Practical Use for Discretionary/Active Traders
What the bands mean in practice.
The teal “buy” band marks the lower tail of the recent distribution; the orange “sell” band marks the upper tail. The median is your dynamic equilibrium. In residual mode, these tails are deviations around trend; in raw mode they are absolute price percentiles. When ATR adaptation is on, tails breathe with regime shifts.
Two core playbooks.
1. Mean-reversion around a stable median.
* Context: The median is flat or gently sloped; band width is relatively tight; instrument is ranging.
* Entry (long): Look for price to probe or close below the buy band and then reclaim it, especially after HLC3 recrosses the median and the median turns up.
* Stops: Place beyond the most recent swing low or $1.0–1.5\times$ ATR(14) below entry.
* Targets: First scale at the median; optional second scale near the opposite band. Trail with the median or an ATR stop.
* Symmetry: Mirror the rules for shorts near the sell band when the median is flat to down.
2. Continuation with latched confirmations.
* Context: A developing trend where you want fewer but cleaner signals.
* Entry (long): Take the latched BUY (3-step confirmation) on close, or on the next bar if you require bar-close validation.
* Invalidation: A close back below the median (or below the lower band in strong trends) negates momentum.
* Exits: Trail under the median for conservative exits or under the teal band for trend-following exits. Consider scaling at structure (prior swing highs) or at a fixed $R$ multiple.
Parameter guidance by timeframe.
* Scalping / LTF (1–5m): $N=30$–$60$, $q_0=0.20$, $k=2$–3, residual mode on, baseline EMA $L=20$, adaptation $s=0.5$–0.7 to handle micro-vol spikes. Expect more signals; rely on latched logic to filter noise.
* Intraday swing (15–60m): $N=60$–$100$, $q_0=0.15$–0.20, $k=3$–4. Residual mode helps but is optional if the instrument trends cleanly. $s=0.3$–0.6.
* Swing / HTF (4H–D): $N=80$–$150$, $q_0=0.10$–0.18, $k=3$–5. Consider `SMA` baseline for smoother residuals and moderate adaptation $s=0.2$–0.4.
Baseline choice.
Use EMA for responsiveness (fast trend shifts) and SMA for stability (smoother residuals). Turning residual mode on is advantageous when price exhibits persistent drift; turning it off is useful when you explicitly want absolute bands.
How to time entries.
Prefer bar-close validation for both band recaptures and latched signals. If you must act intrabar, accept that crosses can “un-cross” before close; compensate with tighter stops or reduced size.
Risk management.
Position size to a fixed fractional risk per trade (e.g., 0.5–1.0% of equity). Define invalidation using structure (swing points) plus ATR. Avoid chasing when distance to the opposite band is small; reward-to-risk degrades rapidly once you are deep inside the distribution.
Combos and filters.
* Pair with a higher-timeframe median slope as a regime filter (trade only in the direction of the HTF median).
* Use band width relative to ATR as a range/trend gauge: unusually narrow bands suggest compression (mean-reversion bias); expanding bands suggest breakout potential (favor latched continuation).
* Volume or session filters (e.g., avoid illiquid hours) can materially improve execution.
Alerts for discretion.
Enable “Cross above Buy Level” / “Cross below Sell Level” for early notices and “Latched BUY/SELL” for conviction entries. Set alerts to “Once per bar close” to avoid noise.
Common pitfalls.
Do not interpret band touches as automatic signals; context matters. A strong trend will often ride the far band (“band walking”) and punish counter-trend fades—use the median slope and latched logic to separate trend from range. Do not oversmooth levels; you will lag breaks. Do not set $q$ too small or too large; extremes reduce statistical meaning and practical distance for stops.
A concise checklist.
1. Is the median flat (range) or sloped (trend)?
2. Is band width expanding or contracting vs ATR?
3. Are we near the tail level aligned with the intended trade?
4. For continuation: did the 3 steps for a latched signal complete?
5. Do stops and targets produce acceptable $R$ (≥1.5–2.0)?
6. Are you trading during liquid hours for the instrument?
Summary. ARQB provides statistically grounded, regime-aware bands and a disciplined, latched confirmation engine. Use the bands as objective context, the median as your equilibrium line, ATR adaptation to stay calibrated across regimes, and the latched logic to time higher-quality discretionary entries.
Disclaimer
No indicator guarantees profits. Adaptive Rolling Quantile Bands is a decision aid; always combine with solid risk management and your own judgment. Backtest, forward test, and size responsibly.
The content provided, including all code and materials, is strictly for educational and informational purposes only. It is not intended as, and should not be interpreted as, financial advice, a recommendation to buy or sell any financial instrument, or an offer of any financial product or service. All strategies, tools, and examples discussed are provided for illustrative purposes to demonstrate coding techniques and the functionality of Pine Script within a trading context.
Any results from strategies or tools provided are hypothetical, and past performance is not indicative of future results. Trading and investing involve high risk, including the potential loss of principal, and may not be suitable for all individuals. Before making any trading decisions, please consult with a qualified financial professional to understand the risks involved.
By using this script, you acknowledge and agree that any trading decisions are made solely at your discretion and risk.
Enhance your trading precision and confidence 🚀
Best regards
Chervolino

Strong Trend CandlesThis indicator highlights trend candles using a mathematically grounded method designed to identify moments when the market is truly dominated by buyers or sellers
Up-Trend Candle (UP):
The open is close to the session’s low.
The close is close to the session’s high.
This structure reflects sustained bullish control from start to finish.
Down-Trend Candle (DOWN):
The open is near the high.
The close is near the low.
This reflects clear bearish control throughout the session.
Precise Definitions Used:
UP-Trend Candle:
Open ≤ Low + 10% of range
Close ≥ High - 20% of range
DOWN-Trend Candle:
Open ≥ High - 10% of range
Close ≤ Low + 20% of range
Here, the range is simply High - Low.
Why are the thresholds different (10% vs 20%)?
This is intentional and based on how markets behave:
The opening price tends to be precise and stable in trend days. A strong trending candle usually opens very close to one end (high or low), reflecting a clean start without hesitation.
The closing price, however, often pulls back slightly before the end of the session—even during strong trends—due to profit-taking or last-minute volatility.
That’s why the close is allowed more tolerance (20%), while the open is held to a stricter threshold (10%). This balance allows the indicator to be strict enough to filter noise, yet flexible enough to capture real trends.
✅ Why this is useful
Unlike vague candle patterns like "bullish engulfing" or "marubozu," this method focuses strictly on structure and positioning, not color or subjective shape. It isolates the candles where one side clearly dominated, offering cleaner entries for breakout, continuation, or confirmation strategies.
You can use this tool to:
Spot high-momentum price action
Confirm breakouts or directional bias
Filter setups based on strong market conviction
🔹 How it works
An Up-Trend Candle is detected when the open is close to the daily low and the close is close to the daily high.
A Down-Trend Candle is detected when the open is close to the daily high and the close is close to the daily low.
The thresholds for “close to high/low” are configurable through the Open % of Range and Close % of Range inputs.
🔹 How to use it
Candles are colored according to their classification.
Colors can be customized in the settings.
This tool can be applied in any timeframe.
⚠️ Notes:
This script does not generate buy/sell signals.
It is designed to help visualize strong candles based on intraday range conditions.
Volume Imbalance Heatmap + Delta Cluster [@darshakssc]🔥 Volume Imbalance Heatmap + Delta Cluster
Created by: @darshakssc
This indicator is designed to visually reveal institutional pressure zones using a combination of:
🔺 Delta Cluster Detection: Highlights candles with strong body ratios and volume spikes, helping identify aggressive buying or selling activity.
🌡️ Real-Time Heatmap Overlay: Background color dynamically adjusts based on volume imbalance relative to its moving average.
🧠 Adaptive Dashboard: Displays live insights into current market imbalance and directional flow (Buy/Sell clusters).
📈 How It Works:
A candle is marked as a Buy Cluster if it closes bullish, has a strong body, and exhibits a volume spike above average.
A Sell Cluster triggers under the inverse conditions.
The heatmap shades the chart background to reflect areas of high or low imbalance using a color gradient.
⚙️ Inputs You Can Adjust:
Volume MA Length
Minimum Body Ratio
Imbalance Multiplier Sensitivity
Dashboard Location
🚫 Note: This is not a buy/sell signal tool, but a visual aid to support institutional flow tracking and confluence with your existing system.
For educational use only. Not financial advice.

Hurst Exponent Adaptive Filter (HEAF) [PhenLabs]📊 PhenLabs - Hurst Exponent Adaptive Filter (HEAF)
Version: PineScript™ v6
📌 Description
The Hurst Exponent Adaptive Filter (HEAF) is an advanced Pine Script indicator designed to dynamically adjust moving average calculations based on real time market regimes detected through the Hurst Exponent. The intention behind the creation of this indicator was not a buy/sell indicator but rather a tool to help sharpen traders ability to distinguish regimes in the market mathematically rather than guessing. By analyzing price persistence, it identifies whether the market is trending, mean-reverting, or exhibiting random walk behavior, automatically adapting the MA length to provide more responsive alerts in volatile conditions and smoother outputs in stable ones. This helps traders avoid false signals in choppy markets and capitalize on strong trends, making it ideal for adaptive trading strategies across various timeframes and assets.
Unlike traditional moving averages, HEAF incorporates fractal dimension analysis via the Hurst Exponent to create a self-tuning filter that evolves with market conditions. Traders benefit from visual cues like color coded regimes, adaptive bands for volatility channels, and an information panel that suggests appropriate strategies, enhancing decision making without constant manual adjustments by the user.
🚀 Points of Innovation
Dynamic MA length adjustment using Hurst Exponent for regime-aware filtering, reducing lag in trends and noise in ranges.
Integrated market regime classification (trending, mean-reverting, random) with visual and alert-based notifications.
Customizable color themes and adaptive bands that incorporate ATR for volatility-adjusted channels.
Built-in information panel providing real-time strategy recommendations based on detected regimes.
Power sensitivity parameter to fine-tune adaptation aggressiveness, allowing personalization for different trading styles.
Support for multiple MA types (EMA, SMA, WMA) within an adaptive framework.
🔧 Core Components
Hurst Exponent Calculation: Computes the fractal dimension of price series over a user-defined lookback to detect market persistence or anti-persistence.
Adaptive Length Mechanism: Maps Hurst values to MA lengths between minimum and maximum bounds, using a power function for sensitivity control.
Moving Average Engine: Applies the chosen MA type (EMA, SMA, or WMA) to the adaptive length for the core filter line.
Adaptive Bands: Creates upper and lower channels using ATR multiplied by a band factor, scaled to the current adaptive length.
Regime Detection: Classifies market state with thresholds (e.g., >0.55 for trending) and triggers alerts on regime changes.
Visualization System: Includes gradient fills, regime-colored MA lines, and an info panel for at-a-glance insights.
🔥 Key Features
Regime-Adaptive Filtering: Automatically shortens MA in mean-reverting markets for quick responses and lengthens it in trends for smoother signals, helping traders stay aligned with market dynamics.
Custom Alerts: Notifies on regime shifts and band breakouts, enabling timely strategy adjustments like switching to trend-following in bullish regimes.
Visual Enhancements: Color-coded MA lines, gradient band fills, and an optional info panel that displays market state and trading tips, improving chart readability.
Flexible Settings: Adjustable lookback, min/max lengths, sensitivity power, MA type, and themes to suit various assets and timeframes.
Band Breakout Signals: Highlights potential overbought/oversold conditions via ATR-based channels, useful for entry/exit timing.
🎨 Visualization
Main Adaptive MA Line: Plotted with regime-based colors (e.g., green for trending) to visually indicate market state and filter position relative to price.
Adaptive Bands: Upper and lower lines with gradient fills between them, showing volatility channels that widen in random regimes and tighten in trends.
Price vs. MA Fills: Color-coded areas between price and MA (e.g., bullish green above MA in trending modes) for quick trend strength assessment.
Information Panel: Top-right table displaying current regime (e.g., "Trending Market") and strategy suggestions like "Follow trends" or "Trade ranges."
📖 Usage Guidelines
Core Settings
Hurst Lookback Period
Default: 100
Range: 20-500
Description: Sets the period for Hurst Exponent calculation; longer values provide more stable regime detection but may lag, while shorter ones are more responsive to recent changes.
Minimum MA Length
Default: 10
Range: 5-50
Description: Defines the shortest possible adaptive MA length, ideal for fast responses in mean-reverting conditions.
Maximum MA Length
Default: 200
Range: 50-500
Description: Sets the longest adaptive MA length for smoothing in strong trends; adjust based on asset volatility.
Sensitivity Power
Default: 2.0
Range: 1.0-5.0
Description: Controls how aggressively the length adapts to Hurst changes; higher values make it more sensitive to regime shifts.
MA Type
Default: EMA
Options: EMA, SMA, WMA
Description: Chooses the moving average calculation method; EMA is more responsive, while SMA/WMA offer different weighting.
🖼️ Visual Settings
Show Adaptive Bands
Default: True
Description: Toggles visibility of upper/lower bands for volatility channels.
Band Multiplier
Default: 1.5
Range: 0.5-3.0
Description: Scales band width using ATR; higher values create wider channels for conservative signals.
Show Information Panel
Default: True
Description: Displays regime info and strategy tips in a top-right panel.
MA Line Width
Default: 2
Range: 1-5
Description: Adjusts thickness of the main MA line for better visibility.
Color Theme
Default: Blue
Options: Blue, Classic, Dark Purple, Vibrant
Description: Selects color scheme for MA, bands, and fills to match user preferences.
🚨 Alert Settings
Enable Alerts
Default: True
Description: Activates notifications for regime changes and band breakouts.
✅ Best Use Cases
Trend-Following Strategies: In detected trending regimes, use the adaptive MA as a trailing stop or entry filter for momentum trades.
Range Trading: During mean-reverting periods, monitor band breakouts for buying dips or selling rallies within channels.
Risk Management in Random Markets: Reduce exposure when random walk is detected, using tight stops suggested in the info panel.
Multi-Timeframe Analysis: Apply on higher timeframes for regime confirmation, then drill down to lower ones for entries.
Volatility-Based Entries: Use upper/lower band crossovers as signals in adaptive channels for overbought/oversold trades.
⚠️ Limitations
Lagging in Transitions: Regime detection may delay during rapid market shifts, requiring confirmation from other tools.
Not a Standalone System: Best used in conjunction with other indicators; random regimes can lead to whipsaws if traded aggressively.
Parameter Sensitivity: Optimal settings vary by asset and timeframe, necessitating backtesting.
💡 What Makes This Unique
Hurst-Driven Adaptation: Unlike static MAs, it uses fractal analysis to self-tune, providing regime-specific filtering that's rare in standard indicators.
Integrated Strategy Guidance: The info panel offers actionable tips tied to regimes, bridging analysis and execution.
Multi-Regime Visualization: Combines adaptive bands, colored fills, and alerts in one tool for comprehensive market state awareness.
🔬 How It Works
Hurst Exponent Computation:
Calculates log returns over the lookback period to derive the rescaled range (R/S) ratio.
Normalizes to a 0-1 value, where >0.55 indicates trending, <0.45 mean-reverting, and in-between random.
Length Adaptation:
Maps normalized Hurst to an MA length via a power function, clamping between min and max.
Applies the selected MA type to close prices using this dynamic length.
Visualization and Signals:
Plots the MA with regime colors, adds ATR-based bands, and fills areas for trend strength.
Triggers alerts on regime changes or band crosses, with the info panel suggesting strategies like momentum riding in trends.
💡 Note:
For optimal results, backtest settings on your preferred assets and combine with volume or momentum indicators. Remember, no indicator guarantees profits—use with proper risk management. Access premium features and support at PhenLabs.

Kimchi Premium Dashboard (Final)📜 Kimchi Premium Dashboard (Live & Daily Log)
🚀 Summary
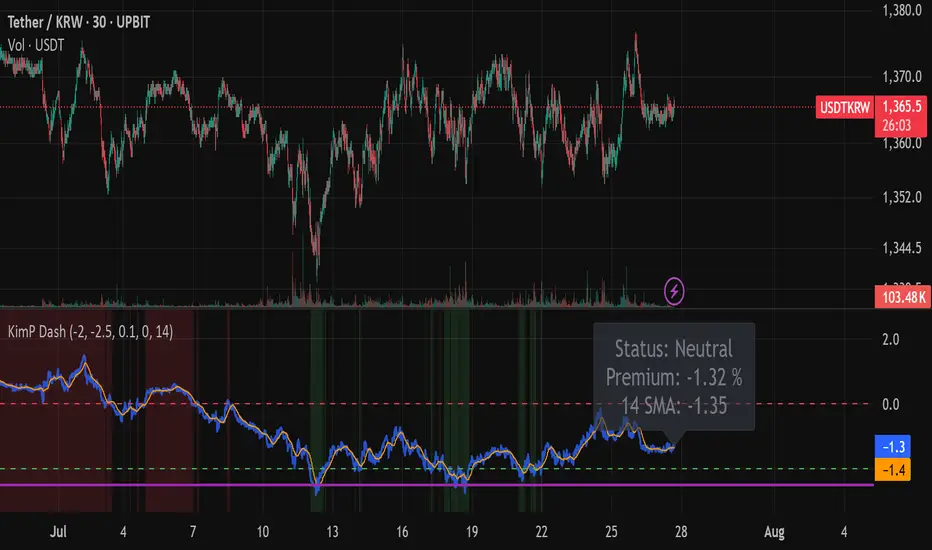
This indicator is an all-in-one dashboard that tracks the real-time price difference of USDT (Tether) between a Korean exchange (Upbit) and a global exchange (Coinbase). This difference is commonly known as the "Kimchi Premium" (Kimp) or "Reverse Premium."
Going beyond a simple premium display, this tool is designed to assist with arbitrage and swing trading strategies by providing intuitive visualizations, a smart multi-tier alert system, and a daily data logging feature.
✨ Key Features
Real-time Premium Calculation: Accurately calculates the premium in percentage (%) based on the USDT prices from Upbit and Coinbase, and the live USD/KRW exchange rate.
Intuitive Zone Visualization: Instantly identify whether the premium is in a Buy, Sell, or Neutral zone through dynamic background coloring.
Smart Alert System: Delivers systematic alerts for key events like the initial -2.0% entry, a critical -2.5% breach, and subsequent new lows, all without unnecessary spam. (Can be toggled ON/OFF in settings).
Hybrid Dashboard: Features both a real-time status label and a daily log that records the day's significant low points.
📊 Visual Components Explained
Lines
🔵 Blue Line (Premium Line): This is the core real-time premium value (%). The position of this line is most important.
🟠 Orange Line (SMA Line): This is the moving average of the premium. It helps identify the overall trend beyond short-term volatility.
Zones
🟩 Green Zone (Buy Zone): This area, typically below -2.0%, indicates a "Reverse Premium" where the Korean price is significantly lower than the global price. It represents a potential buying opportunity for arbitrage.
🟥 Red Zone (Kimp Zone): This area, typically above 0%, indicates a "Kimchi Premium" where the Korean price is higher. This represents a potential selling or profit-taking opportunity.
Dashboard
Live Status Label: Located on the right, this label displays the precise premium value, the current zone status (Buy/Sell/Neutral), and the SMA value in real-time.
Today's Lows Log: Located on the left, this table records the time and level of significant lows (below -2.5%) broken during the day. It resets automatically at midnight (UTC).
🔔 Alerts & How to Use
This indicator provides a systematic 3-tier alert system designed for arbitrage strategies. (Must be enabled via "Enable Real-time Alerts?" in settings).
✅ Good Opportunity (-2.0%): A one-time alert triggers upon the first entry into the initial buying zone.
🚨 BIG Opportunity (-2.5%): A distinct, high-priority alert triggers when this more critical level is breached.
📞 Granular Tracking (Below -2.5%): Receive alerts for each new low in -0.1% increments for precise tracking during the best opportunities.
A recommended hybrid strategy is to keep alerts off for daily review using the "Today's Lows Log," and turn them on only during critical periods for real-time action.
Disclaimer: The information provided by this indicator is for reference purposes only and does not constitute financial advice. All investment decisions and risks are the sole responsibility of the user.
VOLUME Simple [Titans_Invest]VOLUME Simple
A streamlined volume analysis tool crafted for simplicity and smart signal detection.
Although simple in appearance, this indicator brings intelligent volume-based entries through configurable logic. Its design emphasizes clean and effective interpretation of volume signals.
⯁ WHAT IS THE VOLUME INDICATOR❓
The Volume indicator is a fundamental technical analysis tool that measures the number of shares or contracts traded in a security or market during a given period. It helps traders and investors understand the strength or weakness of a price movement, confirm trends, and predict potential reversals. Volume is typically displayed as a histogram below a price chart, with each bar representing the volume traded during a specific time interval.
⯁ HOW TO USE THE VOLUME❓
The Volume indicator can be used in several ways to enhance trading decisions:
• Trend Confirmation: High volume during a price move confirms the strength of that trend, while low volume can indicate a weak or unsustainable trend.
• Breakouts: A price breakout from a pattern or range accompanied by high volume is more likely to be valid and sustainable.
• Divergence: When the price moves in one direction and volume moves in the opposite direction, it can signal a potential reversal.
• Overbought/Oversold Conditions: Extreme volume levels can sometimes indicate that an asset is overbought or oversold, though this is less straightforward than with oscillators like the RSI.
⯁ ENTRY CONDITIONS
The conditions below are fully flexible and allow for complete customization of the signal.
______________________________________________________
🔹 CONDITIONS TO BUY 📈
______________________________________________________
▪︎ Signal Validity: The signal will remain valid for X bars .
🔹 volume > volume_MA * Trigger Signal (close > open)
🔹 volume > volume_MA * Trigger Signal (Keep State)
______________________________________________________
______________________________________________________
🔸 CONDITIONS TO SELL 📉
______________________________________________________
▪︎ Signal Validity: The signal will remain valid for X bars .
🔸 volume > volume_MA * Trigger Signal (close > open)
🔸 volume > volume_MA * Trigger Signal (Keep State)
______________________________________________________
______________________________________________________
🤖 AUTOMATION 🤖
• You can automate the BUY and SELL signals of this indicator.
______________________________________________________
______________________________________________________
⯁ UNIQUE FEATURES
______________________________________________________
Signal Validity: The signal will remain valid for X bars
Condition Table: BUY/SELL
Condition Labels: BUY/SELL
Plot Labels in the Graph Above: BUY/SELL
Automate and Monitor Signals/Alerts: BUY/SELL
Signal Validity: The signal will remain valid for X bars
Table of Conditions: BUY/SELL
Conditions Label: BUY/SELL
Plot Labels in the graph above: BUY/SELL
Automate & Monitor Signals/Alerts: BUY/SELL
______________________________________________________
📜 SCRIPT : VOLUME Simple
🎴 Art by : @Titans_Invest & @DiFlip
👨💻 Dev by : @Titans_Invest & @DiFlip
🎑 Titans Invest — The Wizards Without Gloves 🧤
✨ Enjoy!
______________________________________________________
o Mission 🗺
• Inspire Traders to manifest Magic in the Market.
o Vision 𐓏
• To elevate collective Energy 𐓷𐓏

Drunken Bird Inspiration for the support and resistance plateau lines came from AnotherDAPTrader.
The TSL Drunken Bird is an enhanced technical analysis tool for swing traders on TradingView, based on the original Accurate Swing Trading System by ceyhun. It generates buy and sell signals when price crosses a dynamic Trailing Stop Loss (TSL) level derived from recent highs and lows. This version introduces plateau detection for support and resistance lines, dynamic label expiration to reduce clutter, customizable line styles and decay, and improved HTF confluence for trend-aligned trading. Visual elements include signal labels, horizontal lines, a colored TSL plot, and optional bar/background coloring. Alerts are available for buy/sell crossovers, making it suitable for assets like NASDAQ E-mini futures, stocks, forex, and more.
This script adapts and expands upon ceyhun's original codetradingview.com, adding significant features such as tolerance-based plateau identification for support/resistance, label management with timeframe-aware expiration (~7 days), cross-count decay for lines, and expanded customization options. Inspiration for the support and resistance plateau lines came from AnotherDAPTrader. Released under the Mozilla Public License 2.0.Key
Features
Swing Signals: "BUY" and "SELL" labels on price crossovers/crossunders of the TSL, with a user-defined lookback (default 3).
HTF Confluence: Filters signals based on higher timeframe trend (e.g., "EXIT LONG" instead of "SELL" if HTF is bullish); toggleable.
HTF Options: Select from 5m, 15m, 30m, 1h, 4h, Daily, Weekly, or Monthly.
Plateau Detection: Identifies flat highs/lows (with tolerance) for resistance/support lines, plotted as dotted/solid/dashed with customizable colors, thickness, and decay after crosses (default 2).
Horizontal Lines: Green (buy) and red (sell) lines at signal closes, extending right until crossed; toggle between short (no extension limit) or long visualization.
TSL Visualization: Colored line (green if close >= TSL, red otherwise) for dynamic levels.
Bar/Background Coloring: Optional green/red coloring based on price vs. TSL.
Label Expiration: All labels (signals and plateaus) auto-delete after ~7 days (timeframe-adjusted, default 1008 bars).
Alerts: Triggers for "Buy Signal" and "Sell Signal" on crossovers.
How to Use
Add to Chart: Paste the Pine Script into TradingView's editor and add to your chart.
Configure Settings:
Swing: Lookback for highs/lows (min 1).
Plateau Tolerance: Flatness allowance (default 0.0).
Use HTF Confluence: Enable for trend filtering.
Higher Time Frame: Choose timeframe string.
Barcolor/Bgcolor: Toggle coloring.
Show Plateau Lines: Enable support/resistance.
Line Styles/Colors/Thickness: Customize buy/sell and plateau visuals.
Plateau Line Decay: Crosses before stopping extension.
Label Expiration: Bars for auto-deletion (~7 days).
Interpret Elements:
Labels: "BUY"/"SELL" (green/red), "EXIT SHORT"/"EXIT LONG" (orange) on signals; "Res"/"Sup" on plateaus.
Lines: Extend right until conditions met (cross for buy/sell, decay threshold for plateaus).
TSL Plot: Monitors trend shifts.
Set Alerts: Use "Buy Signal" or "Sell Signal" conditions for notifications.
Testing: Apply to volatile assets; adjust Swing for signal frequency, tolerance for plateau sensitivity.
Ideal Use Cases
Swing trading on 1m–1h charts for entries/exits aligned with HTF trends.
Identifying support/resistance in ranging markets via plateaus.
Scalping with short lookbacks or longer swings with HTF enabled.
Manual or alert-based trading on futures, stocks, or forex.
Why It's Valuable
This indicator builds on ceyhun's core TSL logic with practical enhancements for modern trading: clutter reduction via expiration/decay, visual customization, and plateau-based S/R for better context. It promotes disciplined, trend-aware decisions while maintaining simplicity.
Note: Optimized for any timeframe/asset; test in demo. Not financial advice—use with risk management.

VSA-Stopping VolumeVSA Stopping Volume Indicator
Stopping Volume occurs when candles show decreasing body sizes (narrow spreads) while volume steadily increases.
Example chart:
As you see:
3 consecutive candles in same direction (all green OR all red)
Body sizes (spreads) decreasing progressively: Candle 1 > Candle 2 > Candle 3
Volume increasing progressively: Volume 1 < Volume 2 < Volume 3
This pattern indicates price absorption - increased buying/selling pressure but declining price movement, often signaling exhaustion and potential reversal.
Indicator Features
This indicator detects Stopping Volume candlestick clusters with two signal types:
🔹 BUY/SELL Signals: Generated when pattern occurs at support/resistance zones
🔹 Directional Alerts (▲-green, ▼-red): Generated when pattern occurs outside key levels
Trading Guidelines:
⚠️ Auto-drawn S/R zones are reference only - manual level plotting recommended for accuracy
📊 Best for scalping: M5, M10, M15 timeframes
🛡️ Stop Loss: Place beyond the S/R zone you're trading
🎯 Take Profit: Based on your risk management
Key Concept: Volume expansion + price contraction = potential reversal, especially at SnR levels.
Perfect for scalpers looking to catch reversals at critical zones!

Contrarian Market Structure BreakMarket Structure Break application was inspired and adapted from Market Structure Oscillator indicator developed by Lux Algo. So much credit to their work.
This indicator pairs nicely with the Contrarian 100 MA and can be located here:
Indicator Description: Contrarian Market Structure BreakOverview
The "Contrarian Market Structure Break" indicator is a versatile tool tailored for traders seeking to identify potential reversal opportunities by analyzing market structure across multiple timeframes. Built on Institutional Concepts of Structure (ICT), this indicator detects Break of Structure (BOS) and Change of Character (CHoCH) patterns across short-term, intermediate-term, and long-term swings, plotting them with customizable lines and labels. It generates contrarian buy and sell signals when price breaks key swing levels, with a unique "Blue Dot Tracker" to monitor consecutive buy signals for trend confirmation. Optimized for the daily timeframe, this indicator is adaptable to other timeframes with proper testing, making it ideal for traders of forex, stocks, or cryptocurrencies.
How It Works
The indicator combines three key components to provide a comprehensive view of market dynamics: Multi-Timeframe Market Structure Analysis: It identifies swing highs and lows across short-term, intermediate-term, and long-term periods, plotting BOS (continuation) and CHoCH (reversal) events with customizable line styles and labels.
Contrarian Signal Generation: Buy and sell signals are triggered when the price crosses below swing lows (buy) or above swing highs (sell), indicating potential reversals in overextended markets.
Blue Dot Tracker: A unique feature that counts consecutive buy signals ("blue dots") and highlights a "Hold Investment" state with a yellow background when three or more buy signals occur, suggesting a potential trend continuation.
Signals are visualized as small circles below (buy) or above (sell) price bars, and a table in the bottom-right corner displays the blue dot count and recommended action (Hold or Flip Investment), enhancing decision-making clarity.
Mathematical Concepts Swing Detection: The indicator identifies swing highs and lows by comparing price patterns over three bars, ensuring robust detection of pivot points. A swing high occurs when the middle bar’s high is higher than the surrounding bars, and a swing low occurs when the middle bar’s low is lower.
Market Structure Logic: BOS is detected when the price breaks a prior swing high (bullish) or low (bearish) in the direction of the current trend, while CHoCH signals a potential reversal when the price breaks a swing level against the trend. These are calculated across three timeframes for a multi-dimensional perspective.
Blue Dot Tracker: This feature counts consecutive buy signals and tracks the entry price. If three or more buy signals occur without a sell signal, the indicator enters a "Hold Investment" state, marked by a yellow background, until the price exceeds the entry price or a sell signal occurs.
Entry and Exit Rules Buy Signal (Blue Dot Below Bar): Triggered when the closing price crosses below a swing low on either the intermediate-term or long-term timeframe, suggesting an oversold condition and potential reversal upward. Short-term signals can be enabled but are disabled by default to reduce noise.
Sell Signal (White Dot Above Bar): Triggered when the closing price crosses above a swing high on either the intermediate-term or long-term timeframe, indicating an overbought condition and potential reversal downward.
Blue Dot Tracker Logic: After a buy signal, the indicator increments a blue dot counter and records the entry price. If three or more consecutive buy signals occur (blueDotCount ≥ 3), the indicator enters a "Hold Investment" state, highlighted with a yellow background, suggesting a potential trend continuation. The "Hold Investment" state ends when the price exceeds the entry price or a sell signal occurs, resetting the counter.
Exit Rules: Traders can exit buy positions when a sell signal appears, the price exceeds the entry price during a "Hold Investment" state, or based on additional confirmation from BOS/CHoCH patterns or other technical analysis tools. Always use proper risk management.
Recommended Usage
The indicator is optimized for the daily timeframe, where it effectively captures significant reversal and continuation patterns in trending or ranging markets. It can be adapted to other timeframes (e.g., 1H, 4H, 15M) with careful testing of settings, particularly enabling/disabling short-term structure analysis to suit market conditions. Backtesting is recommended to optimize performance for your chosen asset and timeframe.
Customization Options Market Structure Display: Toggle short-term, intermediate-term, and long-term structures on or off, with customizable line styles (solid, dashed, dotted) and colors for bullish and bearish breaks.
Labels: Enable or disable BOS/CHoCH labels for each timeframe to reduce chart clutter.
Signal Visibility: Hide buy/sell signals if desired for a cleaner chart.
Blue Dot Tracker: Monitor the blue dot count and action (Hold or Flip Investment) via the table display, which is fully customizable in terms of position and appearance.
Why Use This Indicator?
The "Contrarian Market Structure Break" indicator offers a robust framework for identifying high-probability reversal and continuation setups using ICT principles. Its multi-timeframe analysis, clear signal visualization, and innovative Blue Dot Tracker provide traders with actionable insights into market dynamics. Whether you're a swing trader or a day trader, this indicator’s flexibility and intuitive design make it a valuable addition to your trading arsenal.
Note for TradingView Moderators
This script complies with TradingView's House Rules by providing an educational and transparent description without performance claims or guarantees. It is designed to assist traders in technical analysis and should be used alongside proper risk management and personal research. The code is original, well-documented, and includes customizable inputs and clear visual outputs to enhance the user experience.
Tips for Users:
Backtest thoroughly on your chosen asset and timeframe to validate signal reliability. Combine with other indicators or price action analysis for confirmation of entries and exits. Adjust timeframe settings and enable/disable short-term structures to match market volatility and your trading style.
Hope the "Contrarian Market Structure Break" indicator enhances your trading strategy and helps you navigate the markets with confidence! Happy trading!

Easy Position Size Calculator with Fees# Easy Position Size Calculator with Fees - Manual
## Overview
The Easy Position Size Calculator is a Pine Script indicator designed to help traders calculate the optimal position size for their trades while accounting for trading fees. This tool automatically determines whether you're planning a long or short position and calculates the exact position size needed to risk a specific dollar amount.
## Key Features
- **Automatic Trade Direction Detection**: Determines if you're going long or short based on entry price vs stop loss
- **Fee Integration**: Accounts for trading fees in position size calculations
- **Risk Management**: Calculates position size based on your specified risk amount
- **Risk Factor Adjustment**: Allows you to scale your position size up or down
- **Visual Display**: Shows all calculations in a clear, organized table
## Input Parameters
### Entry Price ($)
- **Purpose**: The price at which you plan to enter the trade
- **Default**: 0.0
- **Range**: Any positive value
- **Step**: 0.01
### Stop Loss ($)
- **Purpose**: The price at which you will exit the trade if it goes against you
- **Default**: 0.0
- **Range**: Any positive value
- **Step**: 0.01
### Risk ($)
- **Purpose**: The maximum dollar amount you're willing to lose on this trade
- **Default**: 0.0
- **Range**: Any positive value
- **Step**: 0.01
### Risk Factor
- **Purpose**: A multiplier to scale your position size up or down
- **Default**: 1.0 (no scaling)
- **Range**: 0.0 to 10.0
- **Step**: 0.1
- **Examples**:
- 1.0 = Normal position size
- 2.0 = Double the position size
- 0.5 = Half the position size
### Fee (%)
- **Purpose**: The percentage fee charged per transaction (buy/sell)
- **Default**: 0.01% (0.01)
- **Range**: 0.0% to 1.0%
- **Step**: 0.001
## How It Works
### Trade Direction Detection
The script automatically determines your trade direction:
- **Long Trade**: Entry price > Stop loss price
- **Short Trade**: Entry price < Stop loss price
### Position Size Calculation
#### For Long Trades:
```
Position Size = -Risk Factor × Risk Amount / (Stop Loss × (1 - Fee) - Entry Price × (1 + Fee))
```
#### For Short Trades:
```
Position Size = -Risk Factor × Risk Amount / (Entry Price × (1 - Fee) - Stop Loss × (1 + Fee))
```
### Fee Adjustment
The script accounts for fees on both entry and exit:
- **Long trades**: You pay fees when buying (entry) and selling (exit)
- **Short trades**: You pay fees when shorting (entry) and covering (exit)
## Output Display
The indicator displays a table with the following information:
### Trade Information
- **Trade Type**: Shows whether it's a LONG, SHORT, or INVALID trade
- **Entry Price**: Your specified entry price
- **Stop Loss**: Your specified stop loss price
- **Fee (%)**: The fee percentage being used
### Risk Parameters
- **Risk Amount**: The dollar amount you're willing to risk
- **Risk Factor**: The multiplier being applied
### Calculated Values
- **Effective Entry**: The actual cost per share including fees
- **Effective Exit**: The actual exit value per share including fees
- **Expected Loss**: The calculated loss if stop loss is hit
- **Deviation from Risk %**: Shows how close the expected loss is to your target risk
- **Position Size**: The number of shares/units to trade
## Usage Examples
### Example 1: Long Trade
- Entry Price: $100.00
- Stop Loss: $95.00
- Risk Amount: $500.00
- Risk Factor: 1.0
- Fee: 0.01%
**Result**: The script will calculate how many shares to buy so that if the stop loss is hit, you lose approximately $500 (accounting for fees). Position Size: 99.61152
### Example 2: Short Trade
- Entry Price: $50.00
- Stop Loss: $55.00
- Risk Amount: $300.00
- Risk Factor: 1.0
- Fee: 0.01%
**Result**: The script will calculate how many shares to short so that if the stop loss is hit, you lose approximately $300 (accounting for fees). Position Size: 59.87426
## Important Notes
### Validation Requirements
For the script to work properly, all of the following must be true:
- Entry price > 0
- Stop loss > 0
- Risk amount > 0
- Entry price ≠ Stop loss (to determine direction)
### Negative Position Sizes
The script may show negative position sizes, which is normal:
- **Negative values for long trades**: Represents shares to buy
- **Negative values for short trades**: Represents shares to short
### Risk Deviation
The "Deviation from Risk %" shows how closely the calculated position size matches your target risk. Small deviations are normal due to:
- Fee calculations
- Rounding
- Market precision
## Color Coding
The table uses color coding for easy identification:
- **Green**: Long trade information
- **Red**: Short trade information
- **Gray**: Invalid trade (when inputs are incorrect)
- **Blue**: Final position size
- **Red background**: Risk-related calculations
## Troubleshooting
### Common Issues
1. **Position Size shows 0**
- Check that all inputs are greater than 0
- Ensure entry price is different from stop loss
2. **Trade Type shows INVALID**
- Verify that entry price and stop loss are both positive
- Make sure entry price ≠ stop loss
3. **Large Risk Deviation**
- This is normal for very small position sizes
- Consider adjusting your risk amount or price levels
## Best Practices
1. **Always validate your inputs** before placing actual trades
2. **Double-check the trade direction** shown in the table
3. **Review the expected loss** to ensure it aligns with your risk management
4. **Consider the effective entry/exit prices** which include fees
5. **Use appropriate risk factors** - avoid extreme values that could lead to overexposure
## Disclaimer
This tool is for educational and planning purposes only. Always verify calculations manually and consider market conditions, liquidity, and other factors before placing actual trades. The script assumes that fees are charged on both entry and exit transactions.
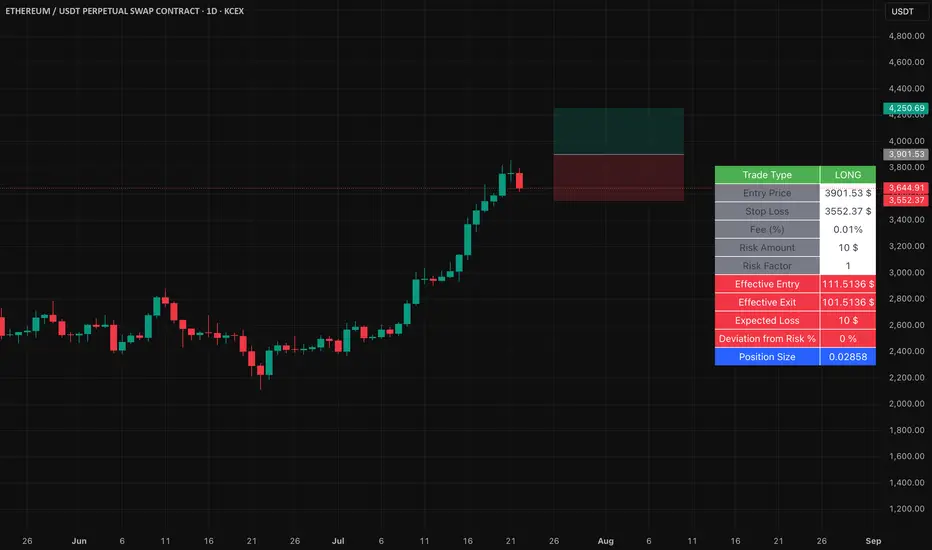
Support Resistance with Order BlocksIndicator Description
Professional Price Level Detection for Smart Trading. Master the Markets with Precision Support/Resistance and Order Block Analysis . It provides traders with clear visual cues for potential reversal and breakout areas, combining both retail and institutional trading concepts into one powerful tool.
The Support & Resistance with Order Blocks indicator is a versatile Pine Script tool designed to empower traders with clear, actionable insights into key market levels. By combining advanced pivot-based support and resistance (S/R) detection with order block (OB) filtering, this indicator delivers clean, high-probability zones for entries, exits, and reversals. With customizable display options (boxes or lines) and intuitive settings, it’s perfect for traders of all styles—whether you’re scalping, swing trading, or investing long-term. Overlay it on your TradingView chart and elevate your trading strategy today!
________________________________________
Key Features
✅ Dynamic Support/Resistance - Auto-adjusting levels based on price action
✅ Smart Order Block Detection - Identifies institutional buying/selling zones
✅ Dual Display Modes - Choose between Boxes or Clean Lines for different chart styles
✅ Customizable Sensitivity - Adjust detection parameters for different markets
✅ Broken Level Markers - Clearly shows when key levels are breached
✅ Timeframe-Adaptive - Automatically adjusts for daily/weekly charts
1. Dynamic Support & Resistance Detection
Identifies critical S/R zones using pivot high/low calculations with adjustable look back periods.
Visualizes active S/R zones with distinct colors and labels ("Support" or "Resistance" for boxes, lines for cleaner charts).
Marks broken S/R levels as "Br S" (broken support) or "Br R" (broken resistance) when historical display is enabled, aiding in breakout and reversal analysis.
2. Smart Order Block Identification
Detects bullish and bearish order blocks based on significant price movements (default: ±0.3% over 5 candles).
Highlights institutional buying/selling zones with customizable colors, displayed as boxes or lines.
Filters out overlapping OB zones to keep your chart clutter-free.
3. Dual Display Options
Boxes or Lines: Choose to display S/R and OB as boxes for detailed zones or lines for a minimalist view.
Line Width Customization: Adjust line widths for S/R and OB (1–5 pixels) for optimal visibility.
Color Customization: Tailor colors for active/broken S/R and bullish/bearish OB zones.
4. Advanced Overlap Filtering
Ensures S/R zones don’t overlap with OB zones or other S/R levels, providing only the most relevant levels.
Limits the number of active zones (default: 10) to maintain chart clarity.
5. Historical S/R Visualization
Optionally display broken S/R levels with distinct colors and labels ("Br S" or "Br R") to track historical price reactions.
Broken levels are dynamically updated and removed (or retained) based on user settings.
6. Timeframe Adaptability
Automatically adjusts pivot detection for daily/weekly timeframes (40-candle look back) versus shorter timeframes (20-candle look back).
Works seamlessly across all asset classes (stocks, forex, crypto, etc.) and timeframes.
________________________________________
How It Works
• Support & Resistance:
Uses ta.pivothigh and ta.pivotlow to detect significant price pivots, with a user-defined look back (default: 5 candles post-pivot).
Plots S/R as boxes (with labels "Support" or "Resistance") or lines, extending to the current bar for real-time relevance.
Broken S/R levels are marked with adjusted colors and labels ("S" or "R" for boxes, "Br S" or "Br R" for lines when historical display is enabled).
• Order Blocks:
Identifies OB based on strong price movements over 4 candles, plotted as boxes or lines at the candle’s midpoint.
Validates OB to prevent overlap, ensuring only significant zones are displayed.
Removes OB zones when price breaks through, keeping the chart focused on active levels.
• Customization:
Toggle S/R and OB visibility, adjust detection sensitivity, and set maximum active zones (4–50).
Fine-tune line widths and colors for a personalized chart experience.
________________________________________
Why Use This Indicator?
• Precision Trading: Pinpoint high-probability entry/exit zones with filtered S/R and OB levels.
• Clean Charts: Overlap filtering and zone limits reduce clutter, focusing on key levels.
• Versatile Display: Switch between boxes for detailed zones or lines for simplicity, with adjustable line widths.
• Institutional Edge: Leverage OB detection to align with institutional activity for smarter trades.
• User-Friendly: Intuitive settings and clear visuals make it accessible for beginners and pros alike.
________________________________________
Settings Overview________________________________________
⚙ Input Parameters
Settings Overview
Display Options:
Display Type: Choose "Boxes" or "Lines" for S/R and OB visualization.
S/R Line Width: Set line thickness for S/R lines (1–5 pixels, default: 2).
OB Line Width: Set line thickness for OB lines (1–5 pixels, default: 2).
Order Block Options:
Show Order Block: Enable/disable OB display.
Bull/Bear OB Colors: Customise border and fill colors for bullish and bearish OB zones.
Support/Resistance Options:
Show S/R: Toggle active S/R zones.
Show Historical S/R: Display broken S/R levels, marked as "Br S" or "Br R" for lines.
Detection Period: Set candle lookback for pivot detection (4–50, default: 5).
Max Active Zones: Limit active S/R and OB zones (4–50, default: 10).
Colors: Customise active and broken S/R colors for clear differentiation.
________________________________________
How to Use
1. Add to Chart: Apply the indicator to your TradingView chart.
2. Customize Settings:
o Select "Boxes" or "Lines" for your preferred display style.
o Adjust line widths, colors, and detection parameters to suit your trading style.
o Enable "Show Historical S/R" to track broken levels with "Br S" and "Br R" labels.
3. Analyze Levels:
o Use support zones (green) for buy entries and resistance zones (red) for sell entries.
o Monitor OB zones for institutional activity, signaling potential reversals or continuations.
o Watch for "Br S" or "Br R" labels to identify breakout opportunities.
4. Combine with Other Tools: Pair with trend indicators, volume analysis, or price action for a robust strategy.
5. Monitor Breakouts: Trade breakouts when price breaches S/R or OB zones, with historical labels providing context.
________________________________________
Example Use Cases
• Swing Trading: Use S/R and OB zones to identify entry/exit points, with historical broken levels for context.
• Breakout Trading: Trade price breaks through S/R or OB, using "Br S" and "Br R" labels to confirm reversals.
• Scalping: Adjust detection period for faster S/R and OB identification on lower timeframes.
________________________________________
• Performance: Optimized for all timeframes, with best results on 5M, 15M, 30M, 1H, 4H, or daily charts for swing trading.
• Compatibility: Works with any asset class and TradingView chart.
________________________________________
Get Started
Transform your trading with Support & Resistance with Order Blocks! Add it to your chart, customize it to your style, and trade with confidence. For questions or feedback, drop a comment on TradingView or message the author. Happy trading! 🚀
________________________________________
Disclaimer: This indicator is for educational and informational purposes only. Always conduct your own analysis and practice proper risk management before trading.

Advanced Currency Strength Meter# Advanced Currency Strength Meter (ACSM)
The Advanced Currency Strength Meter (ACSM) is a scientifically-based indicator that measures relative currency strength using established academic methodologies from international finance and behavioral economics. This indicator provides traders with a comprehensive view of currency market dynamics through multiple analytical frameworks.
### Theoretical Foundation
#### 1. Purchasing Power Parity (PPP) Theory
Based on Cassel's (1918) seminal work and refined by Froot & Rogoff (1995), PPP suggests that exchange rates should reflect relative price levels between countries. The ACSM momentum component captures deviations from long-term equilibrium relationships, providing insights into currency misalignments.
#### 2. Uncovered Interest Rate Parity (UIP) and Carry Trade Theory
Building on Fama (1984) and Lustig et al. (2007), the indicator incorporates volatility-adjusted momentum to capture carry trade flows and interest rate differentials that drive currency strength. This approach helps identify currencies benefiting from interest rate differentials.
#### 3. Behavioral Finance and Currency Momentum
Following Burnside et al. (2011) and Menkhoff et al. (2012), the model recognizes that currency markets exhibit persistent momentum effects due to behavioral biases and institutional flows. The indicator captures these momentum patterns for trading opportunities.
#### 4. Portfolio Balance Theory
Based on Branson & Henderson (1985), the relative strength matrix captures how portfolio rebalancing affects currency cross-rates and creates trading opportunities between different currency pairs.
### Technical Implementation
#### Core Methodologies:
- **Z-Score Normalization**: Following Sharpe (1994), provides statistical significance testing without arbitrary scaling
- **Momentum Analysis**: Uses return-based metrics (Jegadeesh & Titman, 1993) for trend identification
- **Volatility Adjustment**: Implements Average True Range methodology (Wilder, 1978) for risk-adjusted strength
- **Composite Scoring**: Equal-weight methodology to avoid overfitting and maintain robustness
- **Correlation Analysis**: Risk management framework based on Markowitz (1952) portfolio theory
#### Key Features:
- **Multi-Source Data Integration**: Supports OANDA, Futures, and CFD data sources
- **Scientific Methodology**: No arbitrary scaling or curve-fitting; all calculations based on established statistical methods
- **Comprehensive Dashboard**: Clean, professional table showing currency strengths and best trading pairs
- **Alert System**: Automated notifications for strong/weak currency conditions and extreme values
- **Best Pair Identification**: Algorithmic detection of highest-potential trading opportunities
### Practical Applications
#### For Swing Traders:
- Identify currencies in strong uptrends or downtrends
- Select optimal currency pairs based on relative strength divergence
- Time entries based on momentum convergence/divergence
#### For Day Traders:
- Use with real-time futures data for intraday opportunities
- Monitor currency correlations for risk management
- Detect early reversal signals through extreme value alerts
#### For Portfolio Managers:
- Multi-currency exposure analysis
- Risk management through correlation monitoring
- Strategic currency allocation decisions
### Visual Design
The indicator features a clean, professional dashboard that displays:
- **Currency Strength Values**: Each major currency (EUR, GBP, JPY, CHF, AUD, CAD, NZD, USD) with color-coded strength values
- **Best Trading Pairs**: Filtered list of highest-potential currency pairs with BUY/SELL signals
- **Market Analysis**: Real-time identification of strongest and weakest currencies
- **Potential Score**: Quantitative measure of trading opportunity strength
### Data Sources and Latency
The indicator supports multiple data sources to accommodate different trading needs:
- **OANDA (Delayed)**: Free data with 15-20 minute delay, suitable for swing trading
- **Futures (Real-time)**: CME currency futures for real-time analysis
- **CFDs**: Alternative real-time data source option
### Mathematical Framework
#### Strength Calculation:
Momentum = (Price - Price ) / Price * 100
Z-Score = (Price - Mean) / Standard Deviation
Volatility-Adjusted = Momentum / ATR-based Volatility
Composite = 0.5 * Momentum + 0.3 * Z-Score + 0.2 * Volatility-Adjusted
#### USD Strength Derivation:
USD strength is calculated as the weighted average of all USD-based pairs, providing a true baseline for relative strength comparison.
### Performance Considerations
The indicator is optimized for:
- **Computational Efficiency**: Uses Pine Script v6 best practices
- **Memory Management**: Appropriate lookback periods and array handling
- **Visual Clarity**: Clean table design optimized for both light and dark themes
- **Alert Reliability**: Robust signal generation with statistical significance testing
### Limitations and Risk Disclosure
- Model performance may vary during extreme market stress (Black Swan events)
- Requires stable data feeds for accurate calculations
- Not optimized for high-frequency scalping strategies
- Central bank interventions may temporarily distort signals
- Performance assumes normal market conditions with behavioral adjustments
### Academic References
- Branson, W. H., & Henderson, D. W. (1985). "The Specification and Influence of Asset Markets"
- Burnside, C., Eichenbaum, M., & Rebelo, S. (2011). "Carry Trade and Momentum in Currency Markets"
- Cassel, G. (1918). "Abnormal Deviations in International Exchanges"
- Fama, E. F. (1984). "Forward and Spot Exchange Rates"
- Froot, K. A., & Rogoff, K. (1995). "Perspectives on PPP and Long-Run Real Exchange Rates"
- Jegadeesh, N., & Titman, S. (1993). "Returns to Buying Winners and Selling Losers"
- Lustig, H., Roussanov, N., & Verdelhan, A. (2007). "Common Risk Factors in Currency Markets"
- Markowitz, H. (1952). "Portfolio Selection"
- Menkhoff, L., Sarno, L., Schmeling, M., & Schrimpf, A. (2012). "Carry Trades and Global FX Volatility"
- Sharpe, W. F. (1994). "The Sharpe Ratio"
- Wilder, J. W. (1978). "New Concepts in Technical Trading Systems"
### Usage Instructions
1. **Setup**: Add the indicator to your chart and select your preferred data source
2. **Currency Selection**: Choose which currencies to analyze (default: all major currencies)
3. **Methodology**: Select calculation method (Composite recommended for most users)
4. **Monitoring**: Watch the dashboard for strength changes and best pair opportunities
5. **Alerts**: Set up notifications for strong/weak currency conditions

Chaikin Money Flow (CMF) [ParadoxAlgo]OVERVIEW
This indicator implements the Chaikin Money Flow oscillator as an overlay on the price chart, designed to help traders identify institutional money flow patterns. The Chaikin Money Flow combines price and volume data to measure the flow of money into and out of a security, making it particularly useful for detecting accumulation and distribution phases.
WHAT IS CHAIKIN MONEY FLOW?
Chaikin Money Flow was developed by Marc Chaikin and measures the amount of Money Flow Volume over a specific period. The indicator oscillates between +1 and -1, where:
Positive values indicate money flowing into the security (accumulation)
Negative values indicate money flowing out of the security (distribution)
Values near zero suggest equilibrium between buying and selling pressure
CALCULATION METHOD
Money Flow Multiplier = ((Close - Low) - (High - Close)) / (High - Low)
Money Flow Volume = Money Flow Multiplier × Volume
CMF = Sum of Money Flow Volume over N periods / Sum of Volume over N periods
KEY FEATURES
Big Money Detection:
Identifies significant institutional activity when CMF exceeds user-defined thresholds
Requires volume confirmation (volume above average) to validate signals
Uses battery icon (🔋) for institutional buying and lightning icon (⚡) for institutional selling
Visual Elements:
Background coloring based on money flow direction
Support and resistance levels calculated using Average True Range
Real-time dashboard showing current CMF value, volume strength, and signal status
Customizable Parameters:
CMF Period: Calculation period for the money flow (default: 20)
Signal Smoothing: EMA smoothing applied to reduce noise (default: 5)
Big Money Threshold: CMF level required to trigger institutional signals (default: 0.15)
Volume Threshold: Volume multiplier required for signal confirmation (default: 1.5x)
INTERPRETATION
Signal Types:
🔋 (Battery): Indicates strong institutional buying when CMF > threshold with high volume
⚡ (Lightning): Indicates strong institutional selling when CMF < -threshold with high volume
Background color: Green tint for positive money flow, red tint for negative money flow
Dashboard Information:
CMF Value: Current Chaikin Money Flow reading
Volume: Current volume as a multiple of 20-period average
Big Money: Status of institutional activity (BUYING/SELLING/QUIET)
Signal: Strength assessment (STRONG/MEDIUM/WEAK)
TRADING APPLICATIONS
Trend Confirmation: Use CMF direction to confirm price trends
Divergence Analysis: Look for divergences between price and money flow
Volume Validation: Confirm breakouts with corresponding money flow
Accumulation/Distribution: Identify phases of institutional activity
PARAMETER RECOMMENDATIONS
Day Trading: CMF Period 14-21, higher sensitivity settings
Swing Trading: CMF Period 20-30, moderate sensitivity
Position Trading: CMF Period 30-50, lower sensitivity for major trends
ALERTS
Optional alert system notifies users when:
Big money buying is detected (CMF above threshold with volume confirmation)
Big money selling is detected (CMF below negative threshold with volume confirmation)
LIMITATIONS
May generate false signals in low-volume conditions
Best used in conjunction with other technical analysis tools
Effectiveness varies across different market conditions and timeframes
EDUCATIONAL PURPOSE
This open-source indicator is provided for educational purposes to help traders understand money flow analysis. It demonstrates the practical application of the Chaikin Money Flow concept with visual enhancements for easier interpretation.
TECHNICAL SPECIFICATIONS
Overlay indicator (displays on price chart)
No repainting - all calculations are based on closed bar data
Suitable for all timeframes and asset classes
Minimal resource usage for optimal performance
DISCLAIMER
This indicator is for educational and informational purposes only. Past performance does not guarantee future results. Always conduct your own analysis and consider risk management before making trading decisions.

Contrarian RSIContrarian RSI Indicator
Pairs nicely with Contrarian 100 MA (optional hide/unhide buy/sell signals)
Description
The Contrarian RSI is a momentum-based technical indicator designed to identify potential reversal points in price action by combining a unique RSI calculation with a predictive range model inspired by the "Contrarian 5 Levels" logic. Unlike traditional RSI, which measures price momentum based solely on price changes, this indicator integrates a smoothed, weighted momentum calculation and predictive price ranges to generate contrarian signals. It is particularly suited for traders looking to capture reversals in trending or range-bound markets.
This indicator is versatile and can be used across various timeframes, though it performs best on higher timeframes (e.g., 1H, 4H, or Daily) due to reduced noise and more reliable signals. Lower timeframes may require additional testing and careful parameter tuning to optimize performance.
How It Works
The Contrarian RSI combines two primary components:
Predictive Ranges (5 Levels Logic): This calculates a smoothed price average that adapts to market volatility using an ATR-based mechanism. It helps identify significant price levels that act as potential support or resistance zones.
Contrarian RSI Calculation: A modified RSI calculation that uses weighted momentum from the predictive ranges to measure buying and selling pressure. The result is smoothed and paired with a user-defined moving average to generate clear signals.
The indicator generates buy (long) and sell (exit) signals based on crossovers and crossunders of user-defined overbought and oversold levels, making it ideal for contrarian trading strategies.
Calculation Overview
Predictive Ranges (5 Levels Logic):
Uses a custom function (pred_ranges) to calculate a dynamic price average (avg) based on the ATR (Average True Range) multiplied by a user-defined factor (mult).
The average adjusts only when the price moves beyond the ATR threshold, ensuring responsiveness to significant price changes while filtering out noise.
This calculation is performed on a user-specified timeframe (tf5Levels) for multi-timeframe analysis.
Contrarian RSI:
Compares consecutive predictive range values to calculate gains (g) and losses (l) over a user-defined period (crsiLength).
Applies a Gaussian weighting function (weight = math.exp(-math.pow(i / crsiLength, 2))) to prioritize recent price movements.
Computes a "wave ratio" (net_momentum / total_energy) to normalize momentum, which is then scaled to a 0–100 range (qrsi = 50 + 50 * wave_ratio).
Smooths the result with a 2-period EMA (qrsi_smoothed) for stability.
Moving Average:
Applies a user-selected moving average (SMA, EMA, WMA, SMMA, or VWMA) with a customizable length (maLength) to the smoothed RSI (qrsi_smoothed) to generate the final indicator value (qrsi_ma).
Signal Generation:
Long Entry: Triggered when qrsi_ma crosses above the oversold level (oversoldLevel, default: 1).
Long Exit: Triggered when qrsi_ma crosses below the overbought level (overboughtLevel, default: 99).
Entry and Exit Rules
Long Entry: Enter a long position when the Contrarian RSI (qrsi_ma) crosses above the oversold level (default: 1). This suggests the asset is potentially oversold and due for a reversal.
Long Exit: Exit the long position when the Contrarian RSI (qrsi_ma) crosses below the overbought level (default: 99), indicating a potential overbought condition and a reversal to the downside.
Customization: Adjust overboughtLevel and oversoldLevel to fine-tune sensitivity. Lower timeframes may benefit from tighter levels (e.g., 20 for oversold, 80 for overbought), while higher timeframes can use extreme levels (e.g., 1 and 99) for stronger reversals.
Timeframe Considerations
Higher Timeframes (Recommended): The indicator is optimized for higher timeframes (e.g., 1H, 4H, Daily) due to its reliance on predictive ranges and smoothed momentum, which perform best with less market noise. These timeframes typically yield more reliable reversal signals.
Lower Timeframes: The indicator can be used on lower timeframes (e.g., 5M, 15M), but signals may be noisier and require additional confirmation (e.g., from price action or other indicators). Extensive backtesting and parameter optimization (e.g., adjusting crsiLength, maLength, or mult) are recommended for lower timeframes.
Inputs
Contrarian RSI Length (crsiLength): Length for RSI momentum calculation (default: 5).
RSI MA Length (maLength): Length of the moving average applied to the RSI (default: 1, effectively no MA).
MA Type (maType): Choose from SMA, EMA, WMA, SMMA, or VWMA (default: SMA).
Overbought Level (overboughtLevel): Upper threshold for exit signals (default: 99).
Oversold Level (oversoldLevel): Lower threshold for entry signals (default: 1).
Plot Signals on Main Chart (plotOnChart): Toggle to display signals on the price chart or the indicator panel (default: false).
Plotted on Lower:
Plotted on Chart:
5 Levels Length (length5Levels): Length for predictive range calculation (default: 200).
Factor (mult): ATR multiplier for predictive ranges (default: 6.0).
5 Levels Timeframe (tf5Levels): Timeframe for predictive range calculation (default: chart timeframe).
Visuals
Contrarian RSI MA: Plotted as a yellow line, representing the smoothed Contrarian RSI with the applied moving average.
Overbought/Oversold Lines: Red line for overbought (default: 99) and green line for oversold (default: 1).
Signals: Blue circles for long entries, white circles for long exits. Signals can be plotted on the main chart (plotOnChart = true) or the indicator panel (plotOnChart = false).
Usage Notes
Use the indicator in conjunction with other tools (e.g., support/resistance, trendlines, or volume) to confirm signals.
Test extensively on your chosen timeframe and asset to optimize parameters like crsiLength, maLength, and mult.
Be cautious with lower timeframes, as false signals may occur due to market noise.
The indicator is designed for contrarian strategies, so it works best in markets with clear reversal patterns.
Disclaimer
This indicator is provided for educational and informational purposes only. Always conduct thorough backtesting and risk management before using any indicator in live trading. The author is not responsible for any financial losses incurred.

Momentum Trajectory Suite📈 Momentum Trajectory Suite
🟢 Overview
Momentum Trajectory Suite is a multi-faceted indicator designed to help traders evaluate trend direction, volatility conditions, and behavioral sentiment in a single consolidated view.
By combining a customizable Trajectory EMA, adaptive Bollinger Bands, and a Greed vs. Fear heatmap, this tool empowers traders to identify directional bias, measure momentum strength, and spot potential reversals or continuation setups.
🧠 Concept
This indicator merges three classic techniques:
Trend Analysis: Trajectory EMA highlights the prevailing directional momentum by smoothing price action over a customizable period.
Volatility Envelopes: Bollinger Bands adapt to dynamic price swings, showing overbought/oversold extremes and periods of contraction or expansion.
Behavioral Sentiment: A Greed vs. Fear heatmap combines RSI and MACD Histogram readings to visualize when markets are dominated by buying enthusiasm or selling pressure.
The combination is designed to help traders interpret market context more effectively than using any single component alone.
🛠️ How to Use the Indicator
Trajectory EMA:
Use the blue EMA line to assess overall trend direction.
Price closing above the EMA may indicate bullish momentum; closing below may indicate bearish bias.
Buy/Sell Signals:
Green circles appear when price crosses above the EMA (potential long entry).
Red circles appear when price crosses below the EMA (potential exit or short entry).
Bollinger Bands:
Monitor upper/lower bands for overbought and oversold price extremes.
Narrowing bands may signal upcoming volatility expansion.
Greed vs. Fear Heatmap:
Green histogram bars indicate bullish sentiment when RSI exceeds 60 and MACD Histogram is positive.
Red histogram bars indicate bearish sentiment when RSI is below 40 and MACD Histogram is negative.
Gray bars indicate neutral or mixed conditions.
Background Color Zones:
The chart background shifts to green when EMA slope is positive and red when negative, providing quick directional cues.
All inputs are adjustable in settings, including EMA length, Bollinger Band parameters, and oscillator configurations.
📊 Interpretation
Bullish Conditions:
Price above the Trajectory EMA, background green, and Greed heatmap active.
May signal trend continuation and increased buying pressure.
Bearish Conditions:
Price below the Trajectory EMA, background red, and Fear heatmap active.
May signal momentum breakdown or potential continuation to the downside.
Volatility Clues:
Wide Bollinger Bands = trending, volatile market.
Narrow Bollinger Bands = low volatility and possible breakout setup.
Signal Confirmation:
Consider combining signals (e.g., EMA crossover + Greed/Fear heatmap + Bollinger Band touch) for higher-confidence entries.
📝 Notes
The script does not repaint or use future data.
Suitable for multiple timeframes (intraday to daily).
May be combined with other confirmation tools or price action analysis.
⚠️ Disclaimer
This script is for educational and informational purposes only and does not constitute financial advice. Trading carries risk and past performance is not indicative of future results. Always perform your own due diligence before making trading decisions.

Tensor Market Analysis Engine (TMAE)# Tensor Market Analysis Engine (TMAE)
## Advanced Multi-Dimensional Mathematical Analysis System
*Where Quantum Mathematics Meets Market Structure*
---
## 🎓 THEORETICAL FOUNDATION
The Tensor Market Analysis Engine represents a revolutionary synthesis of three cutting-edge mathematical frameworks that have never before been combined for comprehensive market analysis. This indicator transcends traditional technical analysis by implementing advanced mathematical concepts from quantum mechanics, information theory, and fractal geometry.
### 🌊 Multi-Dimensional Volatility with Jump Detection
**Hawkes Process Implementation:**
The TMAE employs a sophisticated Hawkes process approximation for detecting self-exciting market jumps. Unlike traditional volatility measures that treat price movements as independent events, the Hawkes process recognizes that market shocks cluster and exhibit memory effects.
**Mathematical Foundation:**
```
Intensity λ(t) = μ + Σ α(t - Tᵢ)
```
Where market jumps at times Tᵢ increase the probability of future jumps through the decay function α, controlled by the Hawkes Decay parameter (0.5-0.99).
**Mahalanobis Distance Calculation:**
The engine calculates volatility jumps using multi-dimensional Mahalanobis distance across up to 5 volatility dimensions:
- **Dimension 1:** Price volatility (standard deviation of returns)
- **Dimension 2:** Volume volatility (normalized volume fluctuations)
- **Dimension 3:** Range volatility (high-low spread variations)
- **Dimension 4:** Correlation volatility (price-volume relationship changes)
- **Dimension 5:** Microstructure volatility (intrabar positioning analysis)
This creates a volatility state vector that captures market behavior impossible to detect with traditional single-dimensional approaches.
### 📐 Hurst Exponent Regime Detection
**Fractal Market Hypothesis Integration:**
The TMAE implements advanced Rescaled Range (R/S) analysis to calculate the Hurst exponent in real-time, providing dynamic regime classification:
- **H > 0.6:** Trending (persistent) markets - momentum strategies optimal
- **H < 0.4:** Mean-reverting (anti-persistent) markets - contrarian strategies optimal
- **H ≈ 0.5:** Random walk markets - breakout strategies preferred
**Adaptive R/S Analysis:**
Unlike static implementations, the TMAE uses adaptive windowing that adjusts to market conditions:
```
H = log(R/S) / log(n)
```
Where R is the range of cumulative deviations and S is the standard deviation over period n.
**Dynamic Regime Classification:**
The system employs hysteresis to prevent regime flipping, requiring sustained Hurst values before regime changes are confirmed. This prevents false signals during transitional periods.
### 🔄 Transfer Entropy Analysis
**Information Flow Quantification:**
Transfer entropy measures the directional flow of information between price and volume, revealing lead-lag relationships that indicate future price movements:
```
TE(X→Y) = Σ p(yₜ₊₁, yₜ, xₜ) log
```
**Causality Detection:**
- **Volume → Price:** Indicates accumulation/distribution phases
- **Price → Volume:** Suggests retail participation or momentum chasing
- **Balanced Flow:** Market equilibrium or transition periods
The system analyzes multiple lag periods (2-20 bars) to capture both immediate and structural information flows.
---
## 🔧 COMPREHENSIVE INPUT SYSTEM
### Core Parameters Group
**Primary Analysis Window (10-100, Default: 50)**
The fundamental lookback period affecting all calculations. Optimization by timeframe:
- **1-5 minute charts:** 20-30 (rapid adaptation to micro-movements)
- **15 minute-1 hour:** 30-50 (balanced responsiveness and stability)
- **4 hour-daily:** 50-100 (smooth signals, reduced noise)
- **Asset-specific:** Cryptocurrency 20-35, Stocks 35-50, Forex 40-60
**Signal Sensitivity (0.1-2.0, Default: 0.7)**
Master control affecting all threshold calculations:
- **Conservative (0.3-0.6):** High-quality signals only, fewer false positives
- **Balanced (0.7-1.0):** Optimal risk-reward ratio for most trading styles
- **Aggressive (1.1-2.0):** Maximum signal frequency, requires careful filtering
**Signal Generation Mode:**
- **Aggressive:** Any component signals (highest frequency)
- **Confluence:** 2+ components agree (balanced approach)
- **Conservative:** All 3 components align (highest quality)
### Volatility Jump Detection Group
**Volatility Dimensions (2-5, Default: 3)**
Determines the mathematical space complexity:
- **2D:** Price + Volume volatility (suitable for clean markets)
- **3D:** + Range volatility (optimal for most conditions)
- **4D:** + Correlation volatility (advanced multi-asset analysis)
- **5D:** + Microstructure volatility (maximum sensitivity)
**Jump Detection Threshold (1.5-4.0σ, Default: 3.0σ)**
Standard deviations required for volatility jump classification:
- **Cryptocurrency:** 2.0-2.5σ (naturally volatile)
- **Stock Indices:** 2.5-3.0σ (moderate volatility)
- **Forex Major Pairs:** 3.0-3.5σ (typically stable)
- **Commodities:** 2.0-3.0σ (varies by commodity)
**Jump Clustering Decay (0.5-0.99, Default: 0.85)**
Hawkes process memory parameter:
- **0.5-0.7:** Fast decay (jumps treated as independent)
- **0.8-0.9:** Moderate clustering (realistic market behavior)
- **0.95-0.99:** Strong clustering (crisis/event-driven markets)
### Hurst Exponent Analysis Group
**Calculation Method Options:**
- **Classic R/S:** Original Rescaled Range (fast, simple)
- **Adaptive R/S:** Dynamic windowing (recommended for trading)
- **DFA:** Detrended Fluctuation Analysis (best for noisy data)
**Trending Threshold (0.55-0.8, Default: 0.60)**
Hurst value defining persistent market behavior:
- **0.55-0.60:** Weak trend persistence
- **0.65-0.70:** Clear trending behavior
- **0.75-0.80:** Strong momentum regimes
**Mean Reversion Threshold (0.2-0.45, Default: 0.40)**
Hurst value defining anti-persistent behavior:
- **0.35-0.45:** Weak mean reversion
- **0.25-0.35:** Clear ranging behavior
- **0.15-0.25:** Strong reversion tendency
### Transfer Entropy Parameters Group
**Information Flow Analysis:**
- **Price-Volume:** Classic flow analysis for accumulation/distribution
- **Price-Volatility:** Risk flow analysis for sentiment shifts
- **Multi-Timeframe:** Cross-timeframe causality detection
**Maximum Lag (2-20, Default: 5)**
Causality detection window:
- **2-5 bars:** Immediate causality (scalping)
- **5-10 bars:** Short-term flow (day trading)
- **10-20 bars:** Structural flow (swing trading)
**Significance Threshold (0.05-0.3, Default: 0.15)**
Minimum entropy for signal generation:
- **0.05-0.10:** Detect subtle information flows
- **0.10-0.20:** Clear causality only
- **0.20-0.30:** Very strong flows only
---
## 🎨 ADVANCED VISUAL SYSTEM
### Tensor Volatility Field Visualization
**Five-Layer Resonance Bands:**
The tensor field creates dynamic support/resistance zones that expand and contract based on mathematical field strength:
- **Core Layer (Purple):** Primary tensor field with highest intensity
- **Layer 2 (Neutral):** Secondary mathematical resonance
- **Layer 3 (Info Blue):** Tertiary harmonic frequencies
- **Layer 4 (Warning Gold):** Outer field boundaries
- **Layer 5 (Success Green):** Maximum field extension
**Field Strength Calculation:**
```
Field Strength = min(3.0, Mahalanobis Distance × Tensor Intensity)
```
The field amplitude adjusts to ATR and mathematical distance, creating dynamic zones that respond to market volatility.
**Radiation Line Network:**
During active tensor states, the system projects directional radiation lines showing field energy distribution:
- **8 Directional Rays:** Complete angular coverage
- **Tapering Segments:** Progressive transparency for natural visual flow
- **Pulse Effects:** Enhanced visualization during volatility jumps
### Dimensional Portal System
**Portal Mathematics:**
Dimensional portals visualize regime transitions using category theory principles:
- **Green Portals (◉):** Trending regime detection (appear below price for support)
- **Red Portals (◎):** Mean-reverting regime (appear above price for resistance)
- **Yellow Portals (○):** Random walk regime (neutral positioning)
**Tensor Trail Effects:**
Each portal generates 8 trailing particles showing mathematical momentum:
- **Large Particles (●):** Strong mathematical signal
- **Medium Particles (◦):** Moderate signal strength
- **Small Particles (·):** Weak signal continuation
- **Micro Particles (˙):** Signal dissipation
### Information Flow Streams
**Particle Stream Visualization:**
Transfer entropy creates flowing particle streams indicating information direction:
- **Upward Streams:** Volume leading price (accumulation phases)
- **Downward Streams:** Price leading volume (distribution phases)
- **Stream Density:** Proportional to information flow strength
**15-Particle Evolution:**
Each stream contains 15 particles with progressive sizing and transparency, creating natural flow visualization that makes information transfer immediately apparent.
### Fractal Matrix Grid System
**Multi-Timeframe Fractal Levels:**
The system calculates and displays fractal highs/lows across five Fibonacci periods:
- **8-Period:** Short-term fractal structure
- **13-Period:** Intermediate-term patterns
- **21-Period:** Primary swing levels
- **34-Period:** Major structural levels
- **55-Period:** Long-term fractal boundaries
**Triple-Layer Visualization:**
Each fractal level uses three-layer rendering:
- **Shadow Layer:** Widest, darkest foundation (width 5)
- **Glow Layer:** Medium white core line (width 3)
- **Tensor Layer:** Dotted mathematical overlay (width 1)
**Intelligent Labeling System:**
Smart spacing prevents label overlap using ATR-based minimum distances. Labels include:
- **Fractal Period:** Time-based identification
- **Topological Class:** Mathematical complexity rating (0, I, II, III)
- **Price Level:** Exact fractal price
- **Mahalanobis Distance:** Current mathematical field strength
- **Hurst Exponent:** Current regime classification
- **Anomaly Indicators:** Visual strength representations (○ ◐ ● ⚡)
### Wick Pressure Analysis
**Rejection Level Mathematics:**
The system analyzes candle wick patterns to project future pressure zones:
- **Upper Wick Analysis:** Identifies selling pressure and resistance zones
- **Lower Wick Analysis:** Identifies buying pressure and support zones
- **Pressure Projection:** Extends lines forward based on mathematical probability
**Multi-Layer Glow Effects:**
Wick pressure lines use progressive transparency (1-8 layers) creating natural glow effects that make pressure zones immediately visible without cluttering the chart.
### Enhanced Regime Background
**Dynamic Intensity Mapping:**
Background colors reflect mathematical regime strength:
- **Deep Transparency (98% alpha):** Subtle regime indication
- **Pulse Intensity:** Based on regime strength calculation
- **Color Coding:** Green (trending), Red (mean-reverting), Neutral (random)
**Smoothing Integration:**
Regime changes incorporate 10-bar smoothing to prevent background flicker while maintaining responsiveness to genuine regime shifts.
### Color Scheme System
**Six Professional Themes:**
- **Dark (Default):** Professional trading environment optimization
- **Light:** High ambient light conditions
- **Classic:** Traditional technical analysis appearance
- **Neon:** High-contrast visibility for active trading
- **Neutral:** Minimal distraction focus
- **Bright:** Maximum visibility for complex setups
Each theme maintains mathematical accuracy while optimizing visual clarity for different trading environments and personal preferences.
---
## 📊 INSTITUTIONAL-GRADE DASHBOARD
### Tensor Field Status Section
**Field Strength Display:**
Real-time Mahalanobis distance calculation with dynamic emoji indicators:
- **⚡ (Lightning):** Extreme field strength (>1.5× threshold)
- **● (Solid Circle):** Strong field activity (>1.0× threshold)
- **○ (Open Circle):** Normal field state
**Signal Quality Rating:**
Democratic algorithm assessment:
- **ELITE:** All 3 components aligned (highest probability)
- **STRONG:** 2 components aligned (good probability)
- **GOOD:** 1 component active (moderate probability)
- **WEAK:** No clear component signals
**Threshold and Anomaly Monitoring:**
- **Threshold Display:** Current mathematical threshold setting
- **Anomaly Level (0-100%):** Combined volatility and volume spike measurement
- **>70%:** High anomaly (red warning)
- **30-70%:** Moderate anomaly (orange caution)
- **<30%:** Normal conditions (green confirmation)
### Tensor State Analysis Section
**Mathematical State Classification:**
- **↑ BULL (Tensor State +1):** Trending regime with bullish bias
- **↓ BEAR (Tensor State -1):** Mean-reverting regime with bearish bias
- **◈ SUPER (Tensor State 0):** Random walk regime (neutral)
**Visual State Gauge:**
Five-circle progression showing tensor field polarity:
- **🟢🟢🟢⚪⚪:** Strong bullish mathematical alignment
- **⚪⚪🟡⚪⚪:** Neutral/transitional state
- **⚪⚪🔴🔴🔴:** Strong bearish mathematical alignment
**Trend Direction and Phase Analysis:**
- **📈 BULL / 📉 BEAR / ➡️ NEUTRAL:** Primary trend classification
- **🌪️ CHAOS:** Extreme information flow (>2.0 flow strength)
- **⚡ ACTIVE:** Strong information flow (1.0-2.0 flow strength)
- **😴 CALM:** Low information flow (<1.0 flow strength)
### Trading Signals Section
**Real-Time Signal Status:**
- **🟢 ACTIVE / ⚪ INACTIVE:** Long signal availability
- **🔴 ACTIVE / ⚪ INACTIVE:** Short signal availability
- **Components (X/3):** Active algorithmic components
- **Mode Display:** Current signal generation mode
**Signal Strength Visualization:**
Color-coded component count:
- **Green:** 3/3 components (maximum confidence)
- **Aqua:** 2/3 components (good confidence)
- **Orange:** 1/3 components (moderate confidence)
- **Gray:** 0/3 components (no signals)
### Performance Metrics Section
**Win Rate Monitoring:**
Estimated win rates based on signal quality with emoji indicators:
- **🔥 (Fire):** ≥60% estimated win rate
- **👍 (Thumbs Up):** 45-59% estimated win rate
- **⚠️ (Warning):** <45% estimated win rate
**Mathematical Metrics:**
- **Hurst Exponent:** Real-time fractal dimension (0.000-1.000)
- **Information Flow:** Volume/price leading indicators
- **📊 VOL:** Volume leading price (accumulation/distribution)
- **💰 PRICE:** Price leading volume (momentum/speculation)
- **➖ NONE:** Balanced information flow
- **Volatility Classification:**
- **🔥 HIGH:** Above 1.5× jump threshold
- **📊 NORM:** Normal volatility range
- **😴 LOW:** Below 0.5× jump threshold
### Market Structure Section (Large Dashboard)
**Regime Classification:**
- **📈 TREND:** Hurst >0.6, momentum strategies optimal
- **🔄 REVERT:** Hurst <0.4, contrarian strategies optimal
- **🎲 RANDOM:** Hurst ≈0.5, breakout strategies preferred
**Mathematical Field Analysis:**
- **Dimensions:** Current volatility space complexity (2D-5D)
- **Hawkes λ (Lambda):** Self-exciting jump intensity (0.00-1.00)
- **Jump Status:** 🚨 JUMP (active) / ✅ NORM (normal)
### Settings Summary Section (Large Dashboard)
**Active Configuration Display:**
- **Sensitivity:** Current master sensitivity setting
- **Lookback:** Primary analysis window
- **Theme:** Active color scheme
- **Method:** Hurst calculation method (Classic R/S, Adaptive R/S, DFA)
**Dashboard Sizing Options:**
- **Small:** Essential metrics only (mobile/small screens)
- **Normal:** Balanced information density (standard desktop)
- **Large:** Maximum detail (multi-monitor setups)
**Position Options:**
- **Top Right:** Standard placement (avoids price action)
- **Top Left:** Wide chart optimization
- **Bottom Right:** Recent price focus (scalping)
- **Bottom Left:** Maximum price visibility (swing trading)
---
## 🎯 SIGNAL GENERATION LOGIC
### Multi-Component Convergence System
**Component Signal Architecture:**
The TMAE generates signals through sophisticated component analysis rather than simple threshold crossing:
**Volatility Component:**
- **Jump Detection:** Mahalanobis distance threshold breach
- **Hawkes Intensity:** Self-exciting process activation (>0.2)
- **Multi-dimensional:** Considers all volatility dimensions simultaneously
**Hurst Regime Component:**
- **Trending Markets:** Price above SMA-20 with positive momentum
- **Mean-Reverting Markets:** Price at Bollinger Band extremes
- **Random Markets:** Bollinger squeeze breakouts with directional confirmation
**Transfer Entropy Component:**
- **Volume Leadership:** Information flow from volume to price
- **Volume Spike:** Volume 110%+ above 20-period average
- **Flow Significance:** Above entropy threshold with directional bias
### Democratic Signal Weighting
**Signal Mode Implementation:**
- **Aggressive Mode:** Any single component triggers signal
- **Confluence Mode:** Minimum 2 components must agree
- **Conservative Mode:** All 3 components must align
**Momentum Confirmation:**
All signals require momentum confirmation:
- **Long Signals:** RSI >50 AND price >EMA-9
- **Short Signals:** RSI <50 AND price 0.6):**
- **Increase Sensitivity:** Catch momentum continuation
- **Lower Mean Reversion Threshold:** Avoid counter-trend signals
- **Emphasize Volume Leadership:** Institutional accumulation/distribution
- **Tensor Field Focus:** Use expansion for trend continuation
- **Signal Mode:** Aggressive or Confluence for trend following
**Range-Bound Markets (Hurst <0.4):**
- **Decrease Sensitivity:** Avoid false breakouts
- **Lower Trending Threshold:** Quick regime recognition
- **Focus on Price Leadership:** Retail sentiment extremes
- **Fractal Grid Emphasis:** Support/resistance trading
- **Signal Mode:** Conservative for high-probability reversals
**Volatile Markets (High Jump Frequency):**
- **Increase Hawkes Decay:** Recognize event clustering
- **Higher Jump Threshold:** Avoid noise signals
- **Maximum Dimensions:** Capture full volatility complexity
- **Reduce Position Sizing:** Risk management adaptation
- **Enhanced Visuals:** Maximum information for rapid decisions
**Low Volatility Markets (Low Jump Frequency):**
- **Decrease Jump Threshold:** Capture subtle movements
- **Lower Hawkes Decay:** Treat moves as independent
- **Reduce Dimensions:** Simplify analysis
- **Increase Position Sizing:** Capitalize on compressed volatility
- **Minimal Visuals:** Reduce distraction in quiet markets
---
## 🚀 ADVANCED TRADING STRATEGIES
### The Mathematical Convergence Method
**Entry Protocol:**
1. **Fractal Grid Approach:** Monitor price approaching significant fractal levels
2. **Tensor Field Confirmation:** Verify field expansion supporting direction
3. **Portal Signal:** Wait for dimensional portal appearance
4. **ELITE/STRONG Quality:** Only trade highest quality mathematical signals
5. **Component Consensus:** Confirm 2+ components agree in Confluence mode
**Example Implementation:**
- Price approaching 21-period fractal high
- Tensor field expanding upward (bullish mathematical alignment)
- Green portal appears below price (trending regime confirmation)
- ELITE quality signal with 3/3 components active
- Enter long position with stop below fractal level
**Risk Management:**
- **Stop Placement:** Below/above fractal level that generated signal
- **Position Sizing:** Based on Mahalanobis distance (higher distance = smaller size)
- **Profit Targets:** Next fractal level or tensor field resistance
### The Regime Transition Strategy
**Regime Change Detection:**
1. **Monitor Hurst Exponent:** Watch for persistent moves above/below thresholds
2. **Portal Color Change:** Regime transitions show different portal colors
3. **Background Intensity:** Increasing regime background intensity
4. **Mathematical Confirmation:** Wait for regime confirmation (hysteresis)
**Trading Implementation:**
- **Trending Transitions:** Trade momentum breakouts, follow trend
- **Mean Reversion Transitions:** Trade range boundaries, fade extremes
- **Random Transitions:** Trade breakouts with tight stops
**Advanced Techniques:**
- **Multi-Timeframe:** Confirm regime on higher timeframe
- **Early Entry:** Enter on regime transition rather than confirmation
- **Regime Strength:** Larger positions during strong regime signals
### The Information Flow Momentum Strategy
**Flow Detection Protocol:**
1. **Monitor Transfer Entropy:** Watch for significant information flow shifts
2. **Volume Leadership:** Strong edge when volume leads price
3. **Flow Acceleration:** Increasing flow strength indicates momentum
4. **Directional Confirmation:** Ensure flow aligns with intended trade direction
**Entry Signals:**
- **Volume → Price Flow:** Enter during accumulation/distribution phases
- **Price → Volume Flow:** Enter on momentum confirmation breaks
- **Flow Reversal:** Counter-trend entries when flow reverses
**Optimization:**
- **Scalping:** Use immediate flow detection (2-5 bar lag)
- **Swing Trading:** Use structural flow (10-20 bar lag)
- **Multi-Asset:** Compare flow between correlated assets
### The Tensor Field Expansion Strategy
**Field Mathematics:**
The tensor field expansion indicates mathematical pressure building in market structure:
**Expansion Phases:**
1. **Compression:** Field contracts, volatility decreases
2. **Tension Building:** Mathematical pressure accumulates
3. **Expansion:** Field expands rapidly with directional movement
4. **Resolution:** Field stabilizes at new equilibrium
**Trading Applications:**
- **Compression Trading:** Prepare for breakout during field contraction
- **Expansion Following:** Trade direction of field expansion
- **Reversion Trading:** Fade extreme field expansion
- **Multi-Dimensional:** Consider all field layers for confirmation
### The Hawkes Process Event Strategy
**Self-Exciting Jump Trading:**
Understanding that market shocks cluster and create follow-on opportunities:
**Jump Sequence Analysis:**
1. **Initial Jump:** First volatility jump detected
2. **Clustering Phase:** Hawkes intensity remains elevated
3. **Follow-On Opportunities:** Additional jumps more likely
4. **Decay Period:** Intensity gradually decreases
**Implementation:**
- **Jump Confirmation:** Wait for mathematical jump confirmation
- **Direction Assessment:** Use other components for direction
- **Clustering Trades:** Trade subsequent moves during high intensity
- **Decay Exit:** Exit positions as Hawkes intensity decays
### The Fractal Confluence System
**Multi-Timeframe Fractal Analysis:**
Combining fractal levels across different periods for high-probability zones:
**Confluence Zones:**
- **Double Confluence:** 2 fractal levels align
- **Triple Confluence:** 3+ fractal levels cluster
- **Mathematical Confirmation:** Tensor field supports the level
- **Information Flow:** Transfer entropy confirms direction
**Trading Protocol:**
1. **Identify Confluence:** Find 2+ fractal levels within 1 ATR
2. **Mathematical Support:** Verify tensor field alignment
3. **Signal Quality:** Wait for STRONG or ELITE signal
4. **Risk Definition:** Use fractal level for stop placement
5. **Profit Targeting:** Next major fractal confluence zone
---
## ⚠️ COMPREHENSIVE RISK MANAGEMENT
### Mathematical Position Sizing
**Mahalanobis Distance Integration:**
Position size should inversely correlate with mathematical field strength:
```
Position Size = Base Size × (Threshold / Mahalanobis Distance)
```
**Risk Scaling Matrix:**
- **Low Field Strength (<2.0):** Standard position sizing
- **Moderate Field Strength (2.0-3.0):** 75% position sizing
- **High Field Strength (3.0-4.0):** 50% position sizing
- **Extreme Field Strength (>4.0):** 25% position sizing or no trade
### Signal Quality Risk Adjustment
**Quality-Based Position Sizing:**
- **ELITE Signals:** 100% of planned position size
- **STRONG Signals:** 75% of planned position size
- **GOOD Signals:** 50% of planned position size
- **WEAK Signals:** No position or paper trading only
**Component Agreement Scaling:**
- **3/3 Components:** Full position size
- **2/3 Components:** 75% position size
- **1/3 Components:** 50% position size or skip trade
### Regime-Adaptive Risk Management
**Trending Market Risk:**
- **Wider Stops:** Allow for trend continuation
- **Trend Following:** Trade with regime direction
- **Higher Position Size:** Trend probability advantage
- **Momentum Stops:** Trail stops based on momentum indicators
**Mean-Reverting Market Risk:**
- **Tighter Stops:** Quick exits on trend continuation
- **Contrarian Positioning:** Trade against extremes
- **Smaller Position Size:** Higher reversal failure rate
- **Level-Based Stops:** Use fractal levels for stops
**Random Market Risk:**
- **Breakout Focus:** Trade only clear breakouts
- **Tight Initial Stops:** Quick exit if breakout fails
- **Reduced Frequency:** Skip marginal setups
- **Range-Based Targets:** Profit targets at range boundaries
### Volatility-Adaptive Risk Controls
**High Volatility Periods:**
- **Reduced Position Size:** Account for wider price swings
- **Wider Stops:** Avoid noise-based exits
- **Lower Frequency:** Skip marginal setups
- **Faster Exits:** Take profits more quickly
**Low Volatility Periods:**
- **Standard Position Size:** Normal risk parameters
- **Tighter Stops:** Take advantage of compressed ranges
- **Higher Frequency:** Trade more setups
- **Extended Targets:** Allow for compressed volatility expansion
### Multi-Timeframe Risk Alignment
**Higher Timeframe Trend:**
- **With Trend:** Standard or increased position size
- **Against Trend:** Reduced position size or skip
- **Neutral Trend:** Standard position size with tight management
**Risk Hierarchy:**
1. **Primary:** Current timeframe signal quality
2. **Secondary:** Higher timeframe trend alignment
3. **Tertiary:** Mathematical field strength
4. **Quaternary:** Market regime classification
---
## 📚 EDUCATIONAL VALUE AND MATHEMATICAL CONCEPTS
### Advanced Mathematical Concepts
**Tensor Analysis in Markets:**
The TMAE introduces traders to tensor analysis, a branch of mathematics typically reserved for physics and advanced engineering. Tensors provide a framework for understanding multi-dimensional market relationships that scalar and vector analysis cannot capture.
**Information Theory Applications:**
Transfer entropy implementation teaches traders about information flow in markets, a concept from information theory that quantifies directional causality between variables. This provides intuition about market microstructure and participant behavior.
**Fractal Geometry in Trading:**
The Hurst exponent calculation exposes traders to fractal geometry concepts, helping understand that markets exhibit self-similar patterns across multiple timeframes. This mathematical insight transforms how traders view market structure.
**Stochastic Process Theory:**
The Hawkes process implementation introduces concepts from stochastic process theory, specifically self-exciting point processes. This provides mathematical framework for understanding why market events cluster and exhibit memory effects.
### Learning Progressive Complexity
**Beginner Mathematical Concepts:**
- **Volatility Dimensions:** Understanding multi-dimensional analysis
- **Regime Classification:** Learning market personality types
- **Signal Democracy:** Algorithmic consensus building
- **Visual Mathematics:** Interpreting mathematical concepts visually
**Intermediate Mathematical Applications:**
- **Mahalanobis Distance:** Statistical distance in multi-dimensional space
- **Rescaled Range Analysis:** Fractal dimension measurement
- **Information Entropy:** Quantifying uncertainty and causality
- **Field Theory:** Understanding mathematical fields in market context
**Advanced Mathematical Integration:**
- **Tensor Field Dynamics:** Multi-dimensional market force analysis
- **Stochastic Self-Excitation:** Event clustering and memory effects
- **Categorical Composition:** Mathematical signal combination theory
- **Topological Market Analysis:** Understanding market shape and connectivity
### Practical Mathematical Intuition
**Developing Market Mathematics Intuition:**
The TMAE serves as a bridge between abstract mathematical concepts and practical trading applications. Traders develop intuitive understanding of:
- **How markets exhibit mathematical structure beneath apparent randomness**
- **Why multi-dimensional analysis reveals patterns invisible to single-variable approaches**
- **How information flows through markets in measurable, predictable ways**
- **Why mathematical models provide probabilistic edges rather than certainties**
---
## 🔬 IMPLEMENTATION AND OPTIMIZATION
### Getting Started Protocol
**Phase 1: Observation (Week 1)**
1. **Apply with defaults:** Use standard settings on your primary trading timeframe
2. **Study visual elements:** Learn to interpret tensor fields, portals, and streams
3. **Monitor dashboard:** Observe how metrics change with market conditions
4. **No trading:** Focus entirely on pattern recognition and understanding
**Phase 2: Pattern Recognition (Week 2-3)**
1. **Identify signal patterns:** Note what market conditions produce different signal qualities
2. **Regime correlation:** Observe how Hurst regimes affect signal performance
3. **Visual confirmation:** Learn to read tensor field expansion and portal signals
4. **Component analysis:** Understand which components drive signals in different markets
**Phase 3: Parameter Optimization (Week 4-5)**
1. **Asset-specific tuning:** Adjust parameters for your specific trading instrument
2. **Timeframe optimization:** Fine-tune for your preferred trading timeframe
3. **Sensitivity adjustment:** Balance signal frequency with quality
4. **Visual customization:** Optimize colors and intensity for your trading environment
**Phase 4: Live Implementation (Week 6+)**
1. **Paper trading:** Test signals with hypothetical trades
2. **Small position sizing:** Begin with minimal risk during learning phase
3. **Performance tracking:** Monitor actual vs. expected signal performance
4. **Continuous optimization:** Refine settings based on real performance data
### Performance Monitoring System
**Signal Quality Tracking:**
- **ELITE Signal Win Rate:** Track highest quality signals separately
- **Component Performance:** Monitor which components provide best signals
- **Regime Performance:** Analyze performance across different market regimes
- **Timeframe Analysis:** Compare performance across different session times
**Mathematical Metric Correlation:**
- **Field Strength vs. Performance:** Higher field strength should correlate with better performance
- **Component Agreement vs. Win Rate:** More component agreement should improve win rates
- **Regime Alignment vs. Success:** Trading with mathematical regime should outperform
### Continuous Optimization Process
**Monthly Review Protocol:**
1. **Performance Analysis:** Review win rates, profit factors, and maximum drawdown
2. **Parameter Assessment:** Evaluate if current settings remain optimal
3. **Market Adaptation:** Adjust for changes in market character or volatility
4. **Component Weighting:** Consider if certain components should receive more/less emphasis
**Quarterly Deep Analysis:**
1. **Mathematical Model Validation:** Verify that mathematical relationships remain valid
2. **Regime Distribution:** Analyze time spent in different market regimes
3. **Signal Evolution:** Track how signal characteristics change over time
4. **Correlation Analysis:** Monitor correlations between different mathematical components
---
## 🌟 UNIQUE INNOVATIONS AND CONTRIBUTIONS
### Revolutionary Mathematical Integration
**First-Ever Implementations:**
1. **Multi-Dimensional Volatility Tensor:** First indicator to implement true tensor analysis for market volatility
2. **Real-Time Hawkes Process:** First trading implementation of self-exciting point processes
3. **Transfer Entropy Trading Signals:** First practical application of information theory for trade generation
4. **Democratic Component Voting:** First algorithmic consensus system for signal generation
5. **Fractal-Projected Signal Quality:** First system to predict signal quality at future price levels
### Advanced Visualization Innovations
**Mathematical Visualization Breakthroughs:**
- **Tensor Field Radiation:** Visual representation of mathematical field energy
- **Dimensional Portal System:** Category theory visualization for regime transitions
- **Information Flow Streams:** Real-time visual display of market information transfer
- **Multi-Layer Fractal Grid:** Intelligent spacing and projection system
- **Regime Intensity Mapping:** Dynamic background showing mathematical regime strength
### Practical Trading Innovations
**Trading System Advances:**
- **Quality-Weighted Signal Generation:** Signals rated by mathematical confidence
- **Regime-Adaptive Strategy Selection:** Automatic strategy optimization based on market personality
- **Anti-Spam Signal Protection:** Mathematical prevention of signal clustering
- **Component Performance Tracking:** Real-time monitoring of algorithmic component success
- **Field-Strength Position Sizing:** Mathematical volatility integration for risk management
---
## ⚖️ RESPONSIBLE USAGE AND LIMITATIONS
### Mathematical Model Limitations
**Understanding Model Boundaries:**
While the TMAE implements sophisticated mathematical concepts, traders must understand fundamental limitations:
- **Markets Are Not Purely Mathematical:** Human psychology, news events, and fundamental factors create unpredictable elements
- **Past Performance Limitations:** Mathematical relationships that worked historically may not persist indefinitely
- **Model Risk:** Complex models can fail during unprecedented market conditions
- **Overfitting Potential:** Highly optimized parameters may not generalize to future market conditions
### Proper Implementation Guidelines
**Risk Management Requirements:**
- **Never Risk More Than 2% Per Trade:** Regardless of signal quality
- **Diversification Mandatory:** Don't rely solely on mathematical signals
- **Position Sizing Discipline:** Use mathematical field strength for sizing, not confidence
- **Stop Loss Non-Negotiable:** Every trade must have predefined risk parameters
**Realistic Expectations:**
- **Mathematical Edge, Not Certainty:** The indicator provides probabilistic advantages, not guaranteed outcomes
- **Learning Curve Required:** Complex mathematical concepts require time to master
- **Market Adaptation Necessary:** Parameters must evolve with changing market conditions
- **Continuous Education Important:** Understanding underlying mathematics improves application
### Ethical Trading Considerations
**Market Impact Awareness:**
- **Information Asymmetry:** Advanced mathematical analysis may provide advantages over other market participants
- **Position Size Responsibility:** Large positions based on mathematical signals can impact market structure
- **Sharing Knowledge:** Consider educational contributions to trading community
- **Fair Market Participation:** Use mathematical advantages responsibly within market framework
### Professional Development Path
**Skill Development Sequence:**
1. **Basic Mathematical Literacy:** Understand fundamental concepts before advanced application
2. **Risk Management Mastery:** Develop disciplined risk control before relying on complex signals
3. **Market Psychology Understanding:** Combine mathematical analysis with behavioral market insights
4. **Continuous Learning:** Stay updated on mathematical finance developments and market evolution
---
## 🔮 CONCLUSION
The Tensor Market Analysis Engine represents a quantum leap forward in technical analysis, successfully bridging the gap between advanced pure mathematics and practical trading applications. By integrating multi-dimensional volatility analysis, fractal market theory, and information flow dynamics, the TMAE reveals market structure invisible to conventional analysis while maintaining visual clarity and practical usability.
### Mathematical Innovation Legacy
This indicator establishes new paradigms in technical analysis:
- **Tensor analysis for market volatility understanding**
- **Stochastic self-excitation for event clustering prediction**
- **Information theory for causality-based trade generation**
- **Democratic algorithmic consensus for signal quality enhancement**
- **Mathematical field visualization for intuitive market understanding**
### Practical Trading Revolution
Beyond mathematical innovation, the TMAE transforms practical trading:
- **Quality-rated signals replace binary buy/sell decisions**
- **Regime-adaptive strategies automatically optimize for market personality**
- **Multi-dimensional risk management integrates mathematical volatility measures**
- **Visual mathematical concepts make complex analysis immediately interpretable**
- **Educational value creates lasting improvement in trading understanding**
### Future-Proof Design
The mathematical foundations ensure lasting relevance:
- **Universal mathematical principles transcend market evolution**
- **Multi-dimensional analysis adapts to new market structures**
- **Regime detection automatically adjusts to changing market personalities**
- **Component democracy allows for future algorithmic additions**
- **Mathematical visualization scales with increasing market complexity**
### Commitment to Excellence
The TMAE represents more than an indicator—it embodies a philosophy of bringing rigorous mathematical analysis to trading while maintaining practical utility and visual elegance. Every component, from the multi-dimensional tensor fields to the democratic signal generation, reflects a commitment to mathematical accuracy, trading practicality, and educational value.
### Trading with Mathematical Precision
In an era where markets grow increasingly complex and computational, the TMAE provides traders with mathematical tools previously available only to institutional quantitative research teams. Yet unlike academic mathematical models, the TMAE translates complex concepts into intuitive visual representations and practical trading signals.
By combining the mathematical rigor of tensor analysis, the statistical power of multi-dimensional volatility modeling, and the information-theoretic insights of transfer entropy, traders gain unprecedented insight into market structure and dynamics.
### Final Perspective
Markets, like nature, exhibit profound mathematical beauty beneath apparent chaos. The Tensor Market Analysis Engine serves as a mathematical lens that reveals this hidden order, transforming how traders perceive and interact with market structure.
Through mathematical precision, visual elegance, and practical utility, the TMAE empowers traders to see beyond the noise and trade with the confidence that comes from understanding the mathematical principles governing market behavior.
Trade with mathematical insight. Trade with the power of tensors. Trade with the TMAE.
*"In mathematics, you don't understand things. You just get used to them." - John von Neumann*
*With the TMAE, mathematical market understanding becomes not just possible, but intuitive.*
— Dskyz, Trade with insight. Trade with anticipation.
